AI-Led Debugging
When a workflow completes but produces unexpected results, pinpointing the exact issue can be challenging. Expedify's AI Debug tab offers a powerful solution, leveraging artificial intelligence to analyze your failed runs. It provides clear, actionable insights, helping you quickly understand what went wrong and how to fix it. This feature is available on every executed node, simplifying your debugging process.
AI Debug Workflow Overview
We'll demonstrate the AI Debug feature using a common workflow error: an orphan task bug where a task is created but not linked to a contact. Previously, this required manual inspection to find a subtle typo. Now, we'll show how AI Debug guides you through opening the problematic run, navigating to the AI Debug tab, selecting the appropriate scope, asking a specific question, and receiving an immediate diagnosis. This process significantly accelerates troubleshooting.
Identifying the Problematic Node
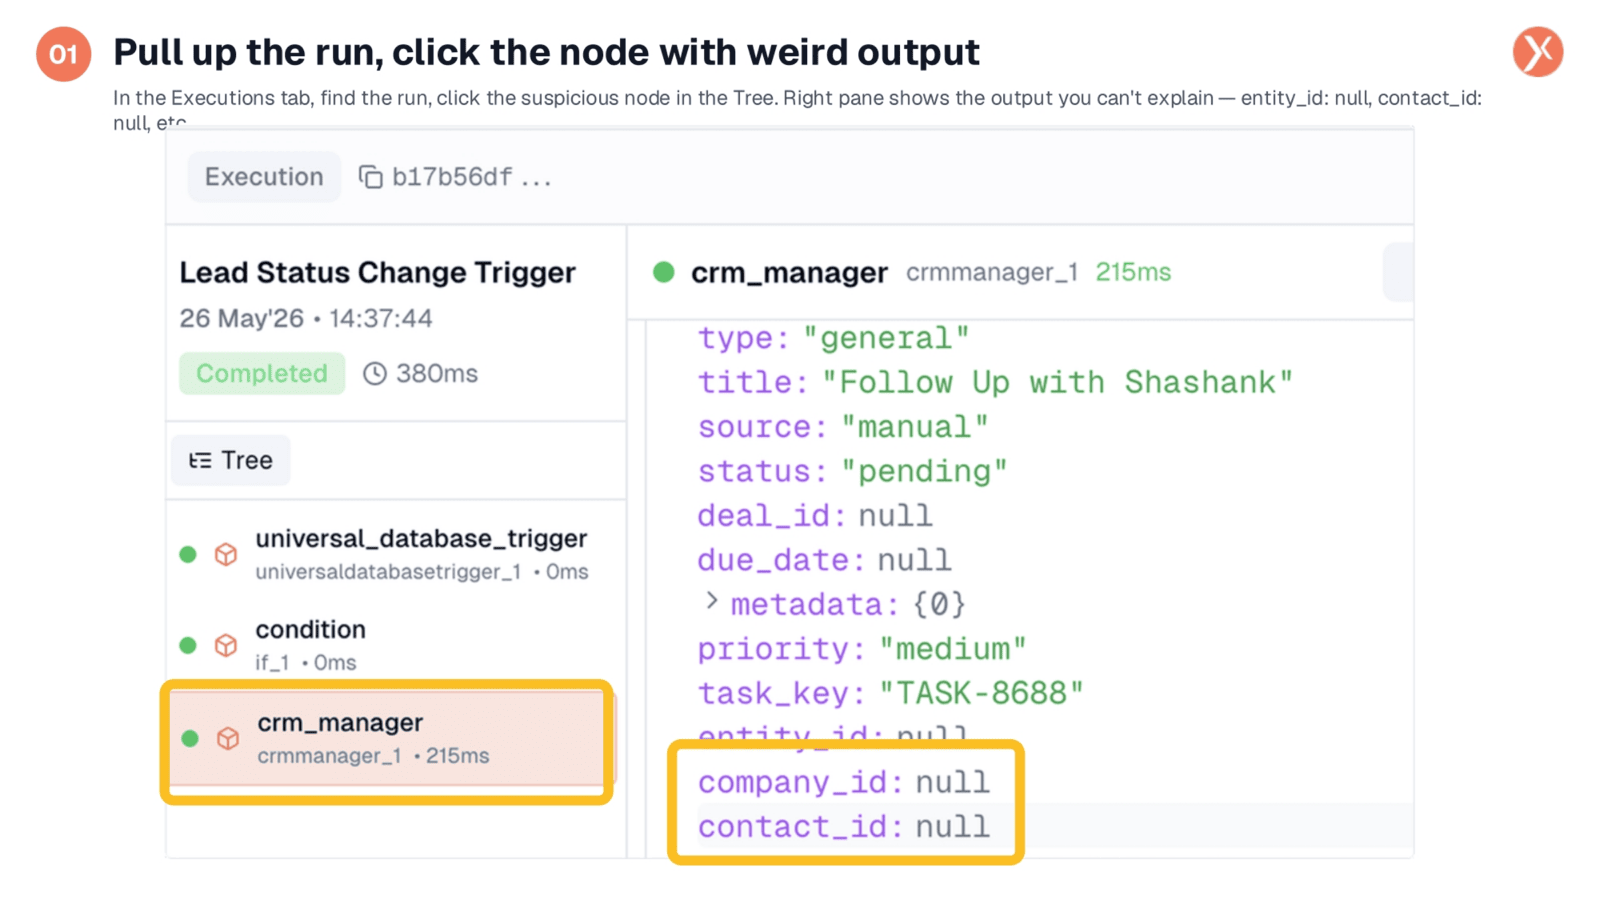
To begin, navigate to the Executions tab and locate the specific run that encountered an issue. In our example, we're looking at a completed run from 14:37. Once identified, click on the 'crm_manager' node within the workflow tree. The right pane will then display the task's output. While many fields may appear correct, a closer look reveals critical fields like 'entity_id', 'company_id', and 'contact_id' are unexpectedly null, indicating the task isn't properly connected.
Exploring the AI Debug Interface
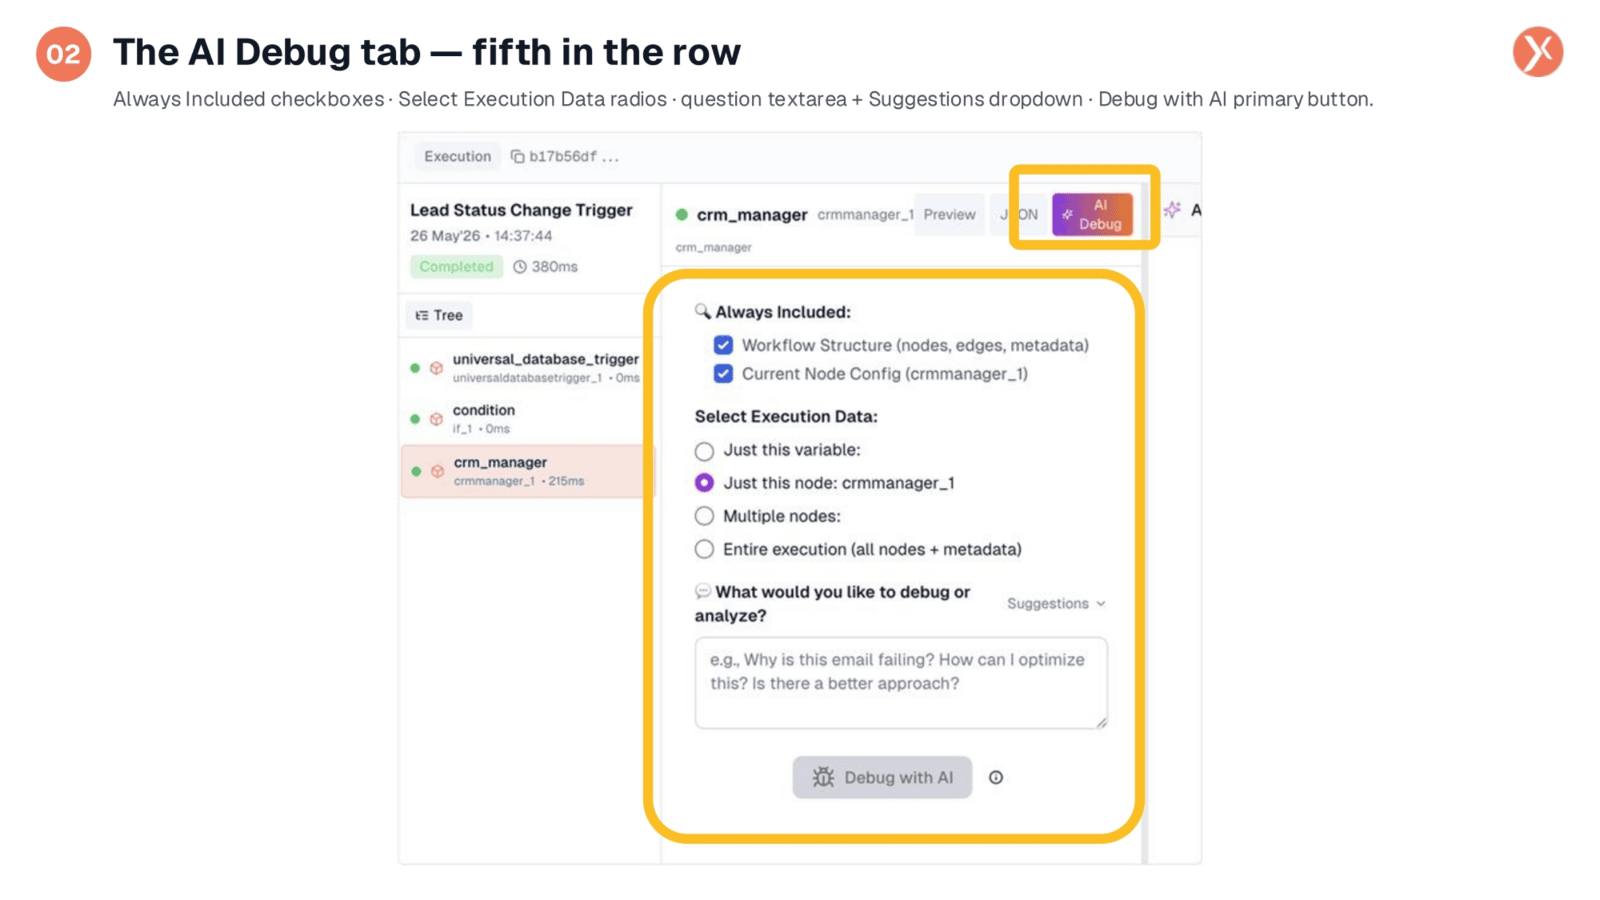
Next, access the AI Debug tab, which is conveniently located alongside the Inputs, Outputs, Preview, and JSON tabs. Upon opening, you'll see four main sections. The "Always Included" section defaults to providing the AI with the workflow's structure and the current node's configuration as essential context. Below this, the "Select Execution Data" section offers various scope options, allowing you to specify what data the AI should analyze.
Defining Scope and Formulating Questions
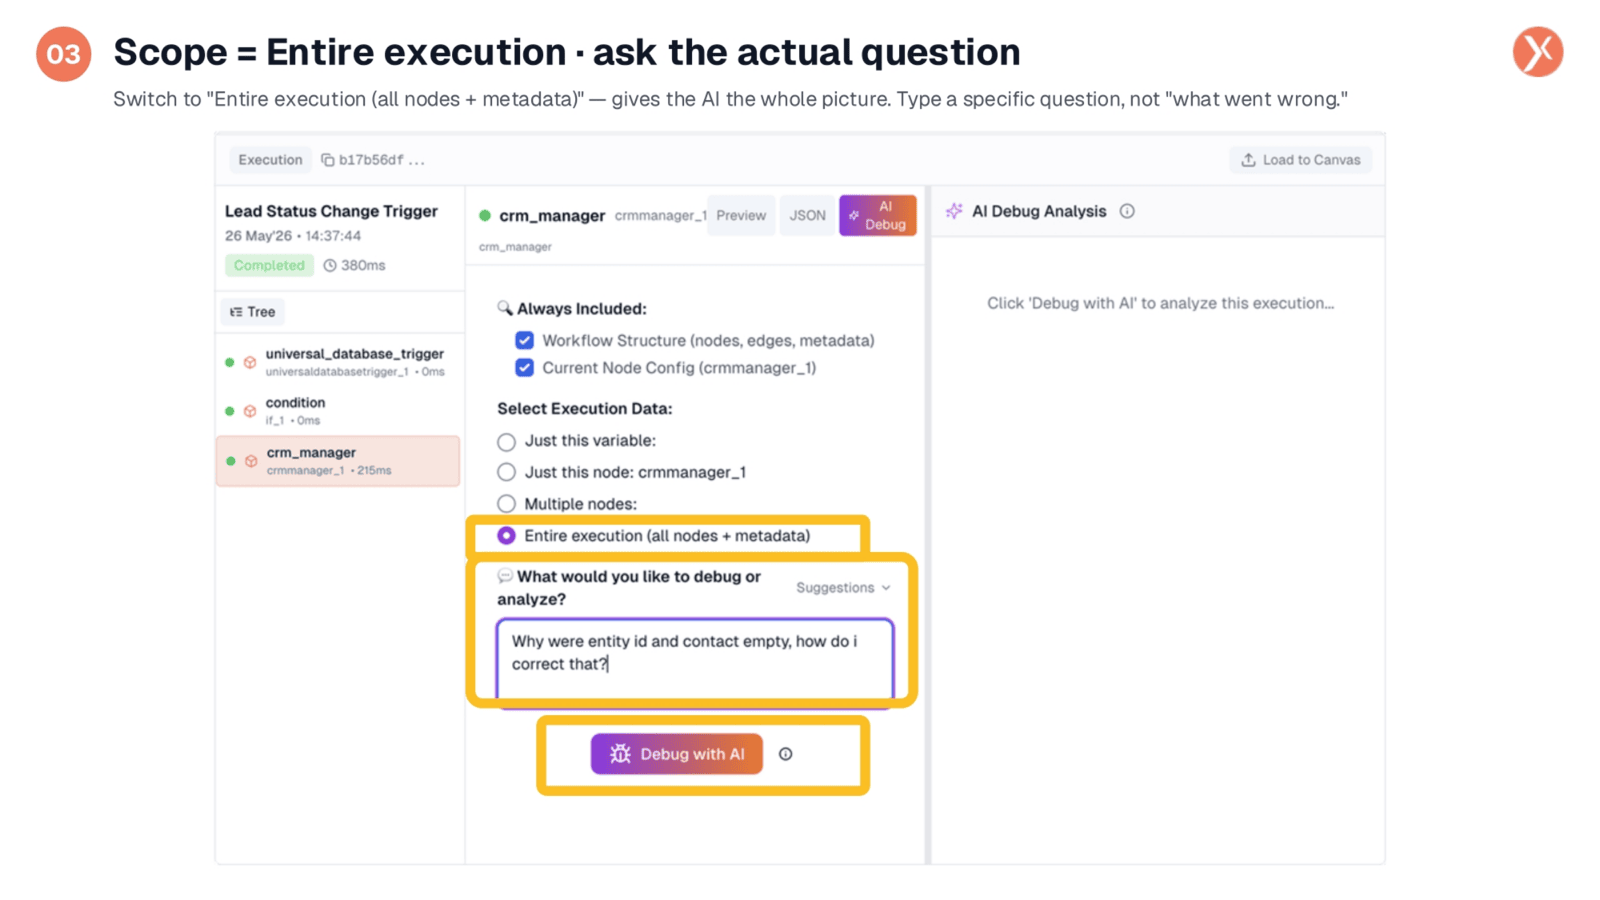
For issues that involve how configuration values impact a run's output across multiple nodes, it's crucial to select "Entire execution" as your scope. This provides the AI with a comprehensive view of the workflow. When formulating your question, be specific and use actual field names from the output you're examining. For instance, instead of a vague "what went wrong?", ask "Why were entity id and contact empty, how do I correct that?" This precision helps the AI deliver a more accurate and useful diagnosis.
Initiating AI Debug Analysis
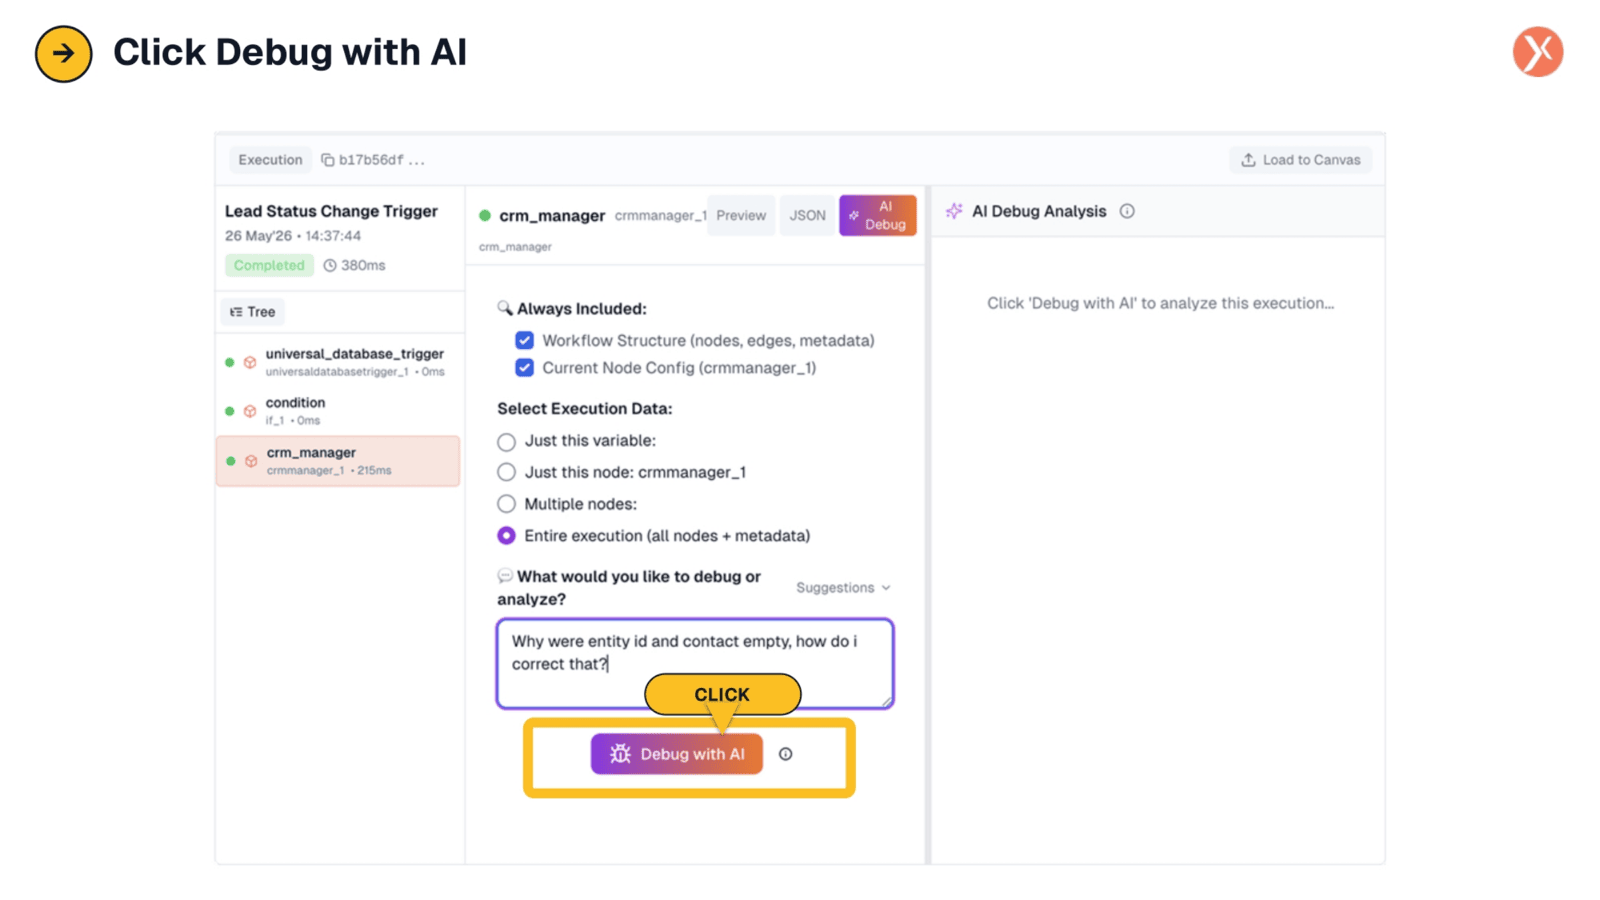
Once you've defined your scope and entered a specific question, the "Debug with AI" button will become active. A single click on this button initiates the AI's analysis of your workflow run. This simple action triggers a powerful diagnostic process, transforming complex execution data into clear, understandable insights. The AI quickly processes the information to provide a root cause analysis, streamlining your debugging efforts.
Understanding the AI's Root Cause Analysis
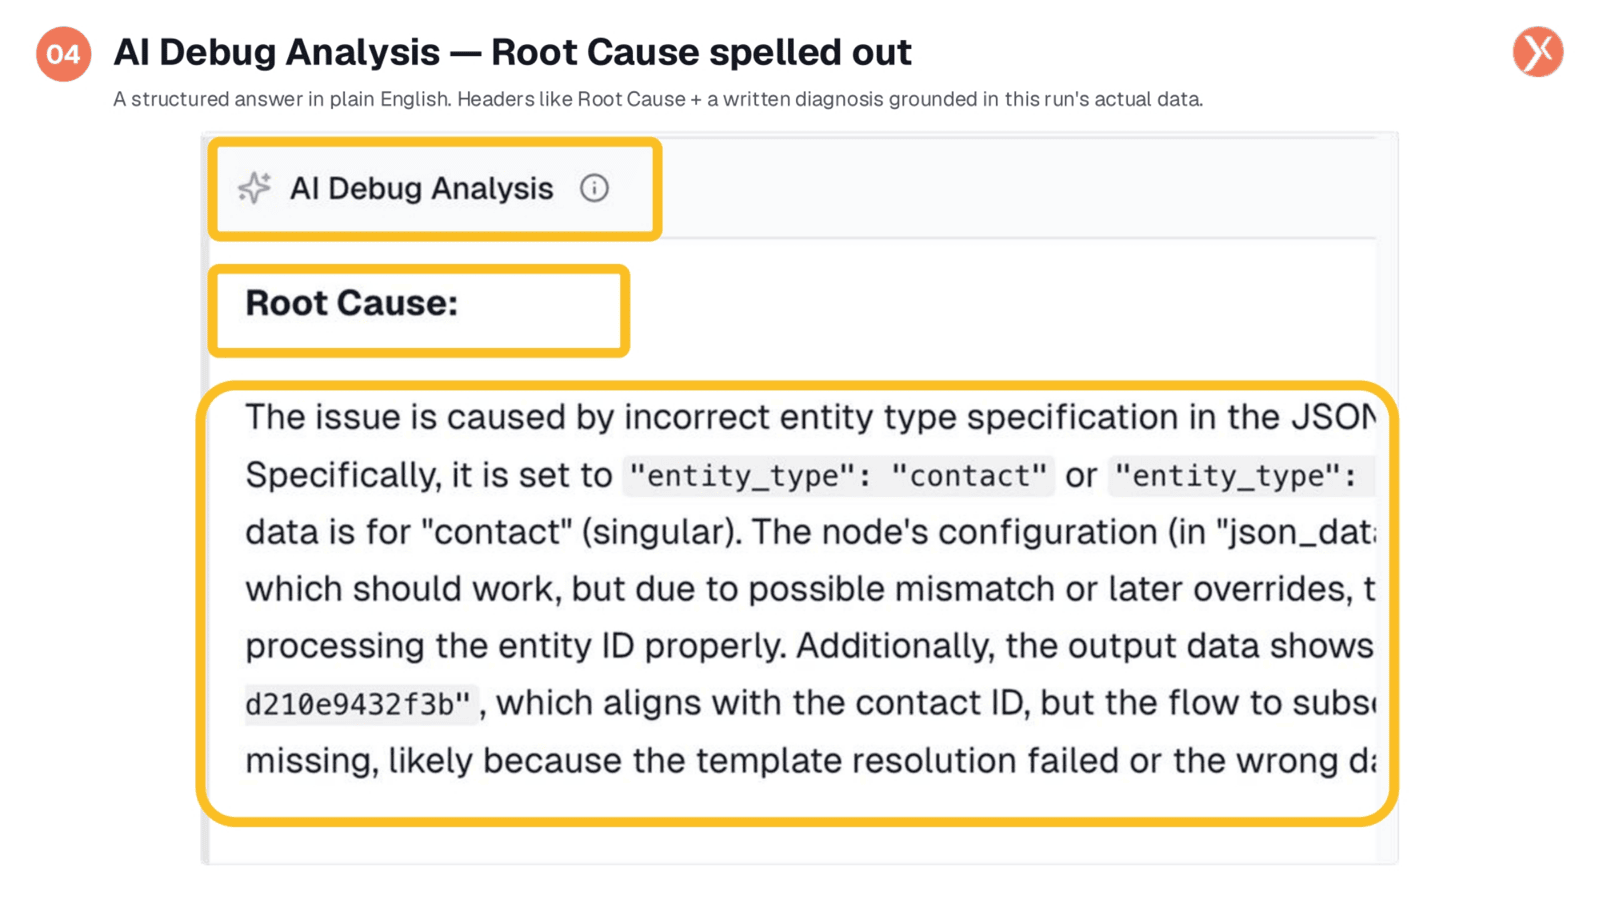
Immediately after initiating the analysis, the right pane populates with a detailed, plain-English response from the AI. This diagnosis typically includes a "Root Cause" section, and sometimes "Suggested Fix" or "Related Notes." The AI clearly explains what it observes in the configuration versus the actual output, often highlighting specific fields like 'entity_type' as the source of the problem. This direct guidance helps you quickly move from a wall of JSON data to a precise area for investigation.
Applying the AI-Guided Fix
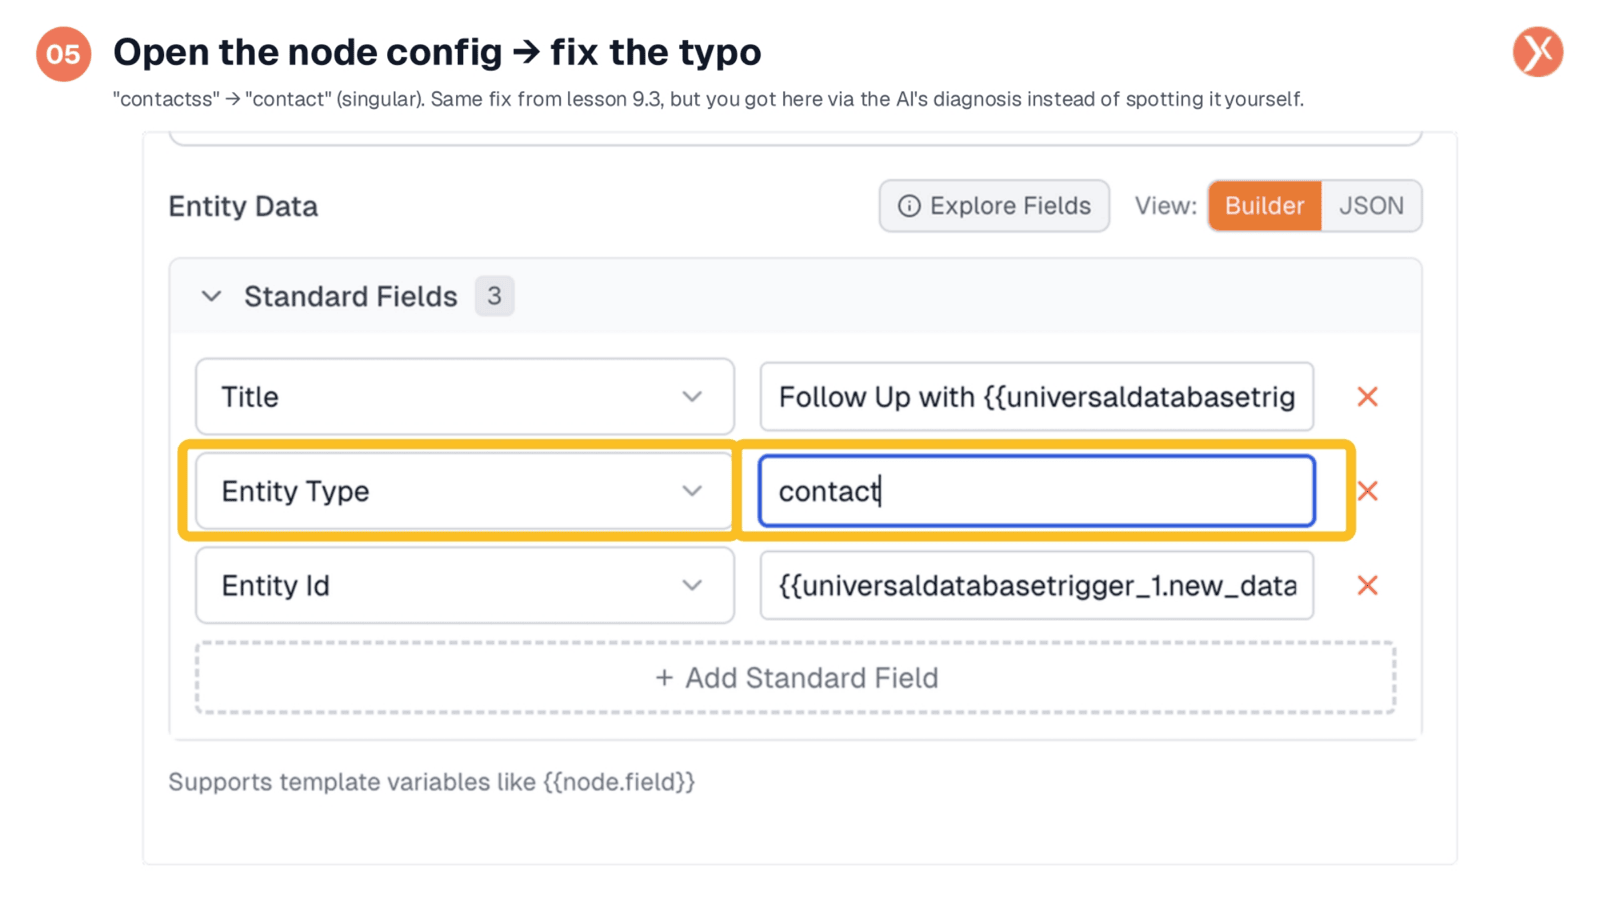
With the AI's diagnosis in hand, you can efficiently navigate back to the Builder and open the configuration of the identified node, in this case, the CRM Manager (Task) node. The AI's insight will lead you directly to the problematic setting, such as an 'Entity Type' field incorrectly set to "contactss" instead of "contact." Correcting this typo and saving the change transforms a previously perplexing issue into a straightforward fix, all within minutes.
Verifying the Solution
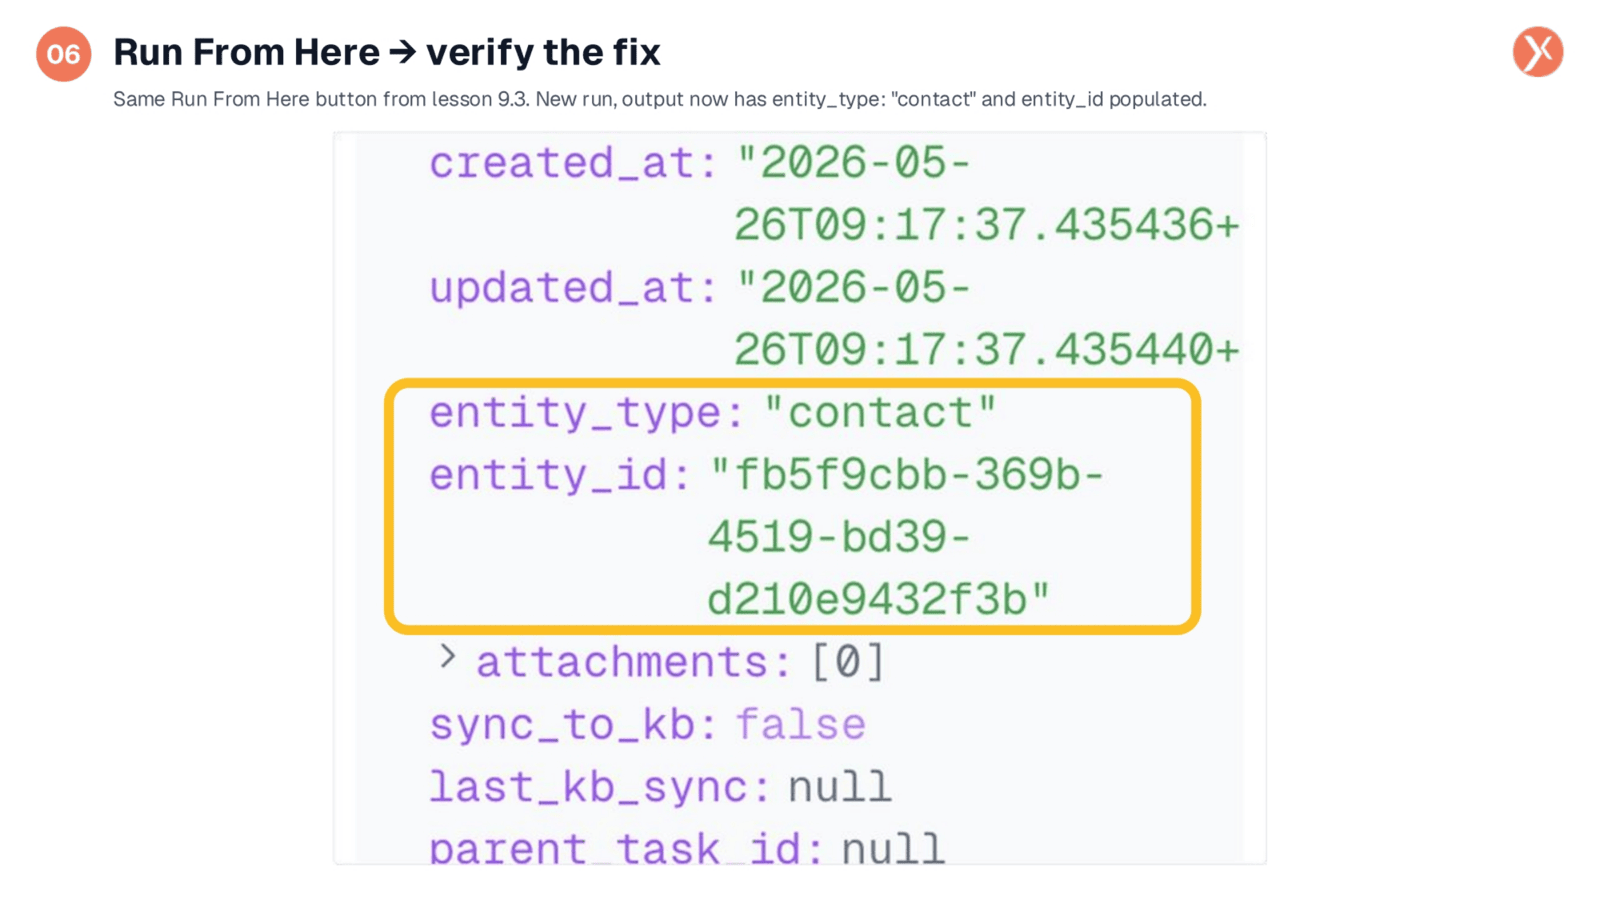
After applying the fix, the next crucial step is to verify that the correction has resolved the issue. Utilize the "Run From Here" feature, which allows for a surgical re-execution of the workflow from the corrected node. Within moments, the task output will refresh, confirming that fields like 'entity_type' and 'entity_id' are now correctly populated with the expected values. This seamless integration of AI Debug for diagnosis and "Run From Here" for re-execution creates an efficient and reliable debugging loop.
Essential Tips for AI Debug
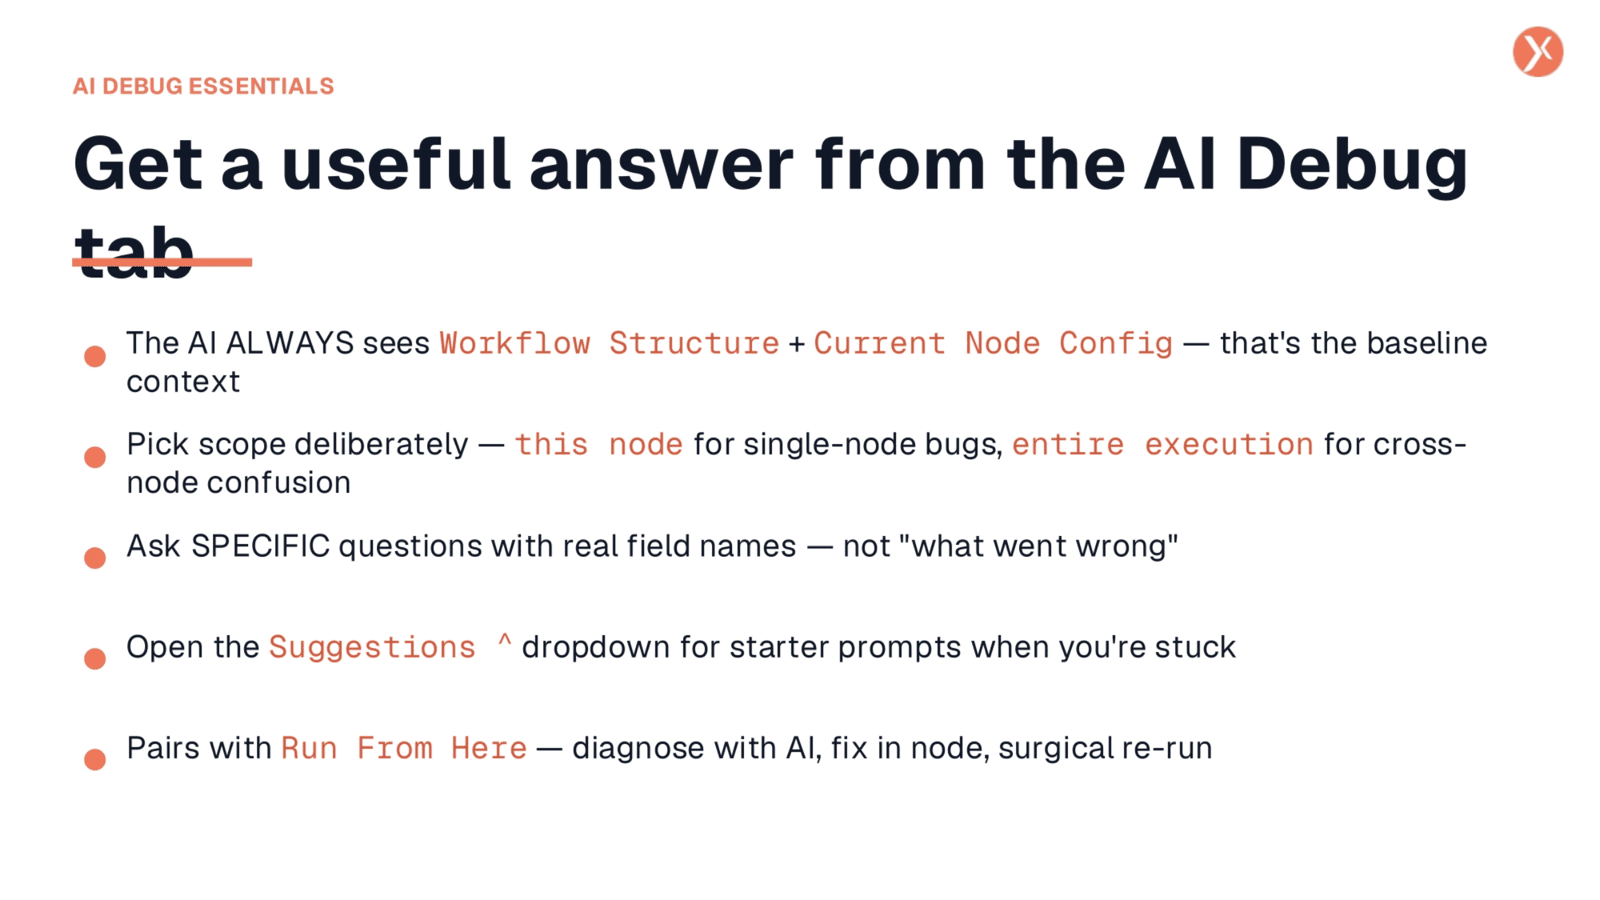
To maximize the utility of AI Debug, remember these five key principles. First, the AI always considers the workflow's structure and the current node's configuration as baseline context. Second, deliberately choose your scope: "Just this node" for isolated issues, or "Entire execution" for broader, cross-node problems. Third, ask specific questions using real field names for precise answers. Fourth, leverage the "Suggestions" dropdown for prompt ideas when you're unsure. Finally, pair AI Debug with "Run From Here" for a complete diagnose, fix, and re-run cycle.
Debugging Workflow Recap and Next Steps
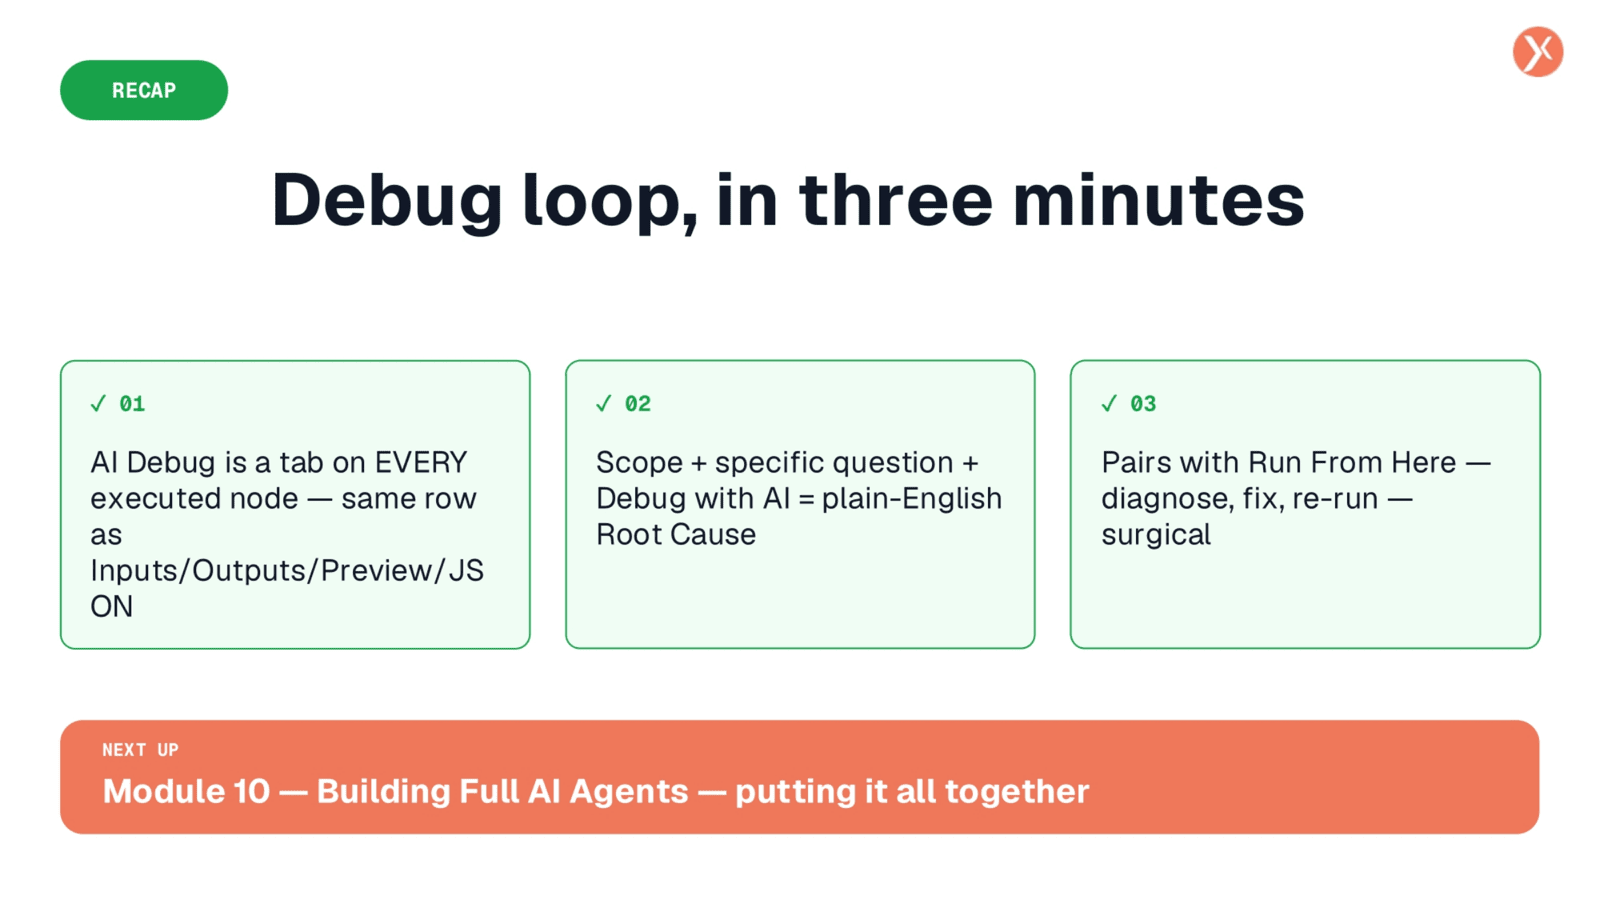
We've now covered the essential debugging toolkit: testing in the Builder, monitoring runs via Logs, and using the Executions tab for history. AI Debug provides rapid diagnosis, while "Run From Here" enables quick verification. This concludes our module on Executions and Debugging. Next, we'll advance to Module 10, where we'll integrate these skills to build comprehensive AI agents.