Executions Panel
The Executions Panel serves as the permanent record for all your workflow runs, unlike temporary logs. It provides a comprehensive view of every test and production run, sorted by time, making it essential for debugging and comparing workflow behaviors over time.
Find, Drill, Copy, Load: Mastering Workflow Runs
The Executions tab empowers you with four core actions: easily finding specific runs, drilling down into individual node details, copying any variable's template path for reuse, and loading past run values back into the editor. This functionality allows for efficient debugging and precise workflow adjustments, ensuring you can always understand and control your automation.
Executions Integrated in the Builder Toolbar
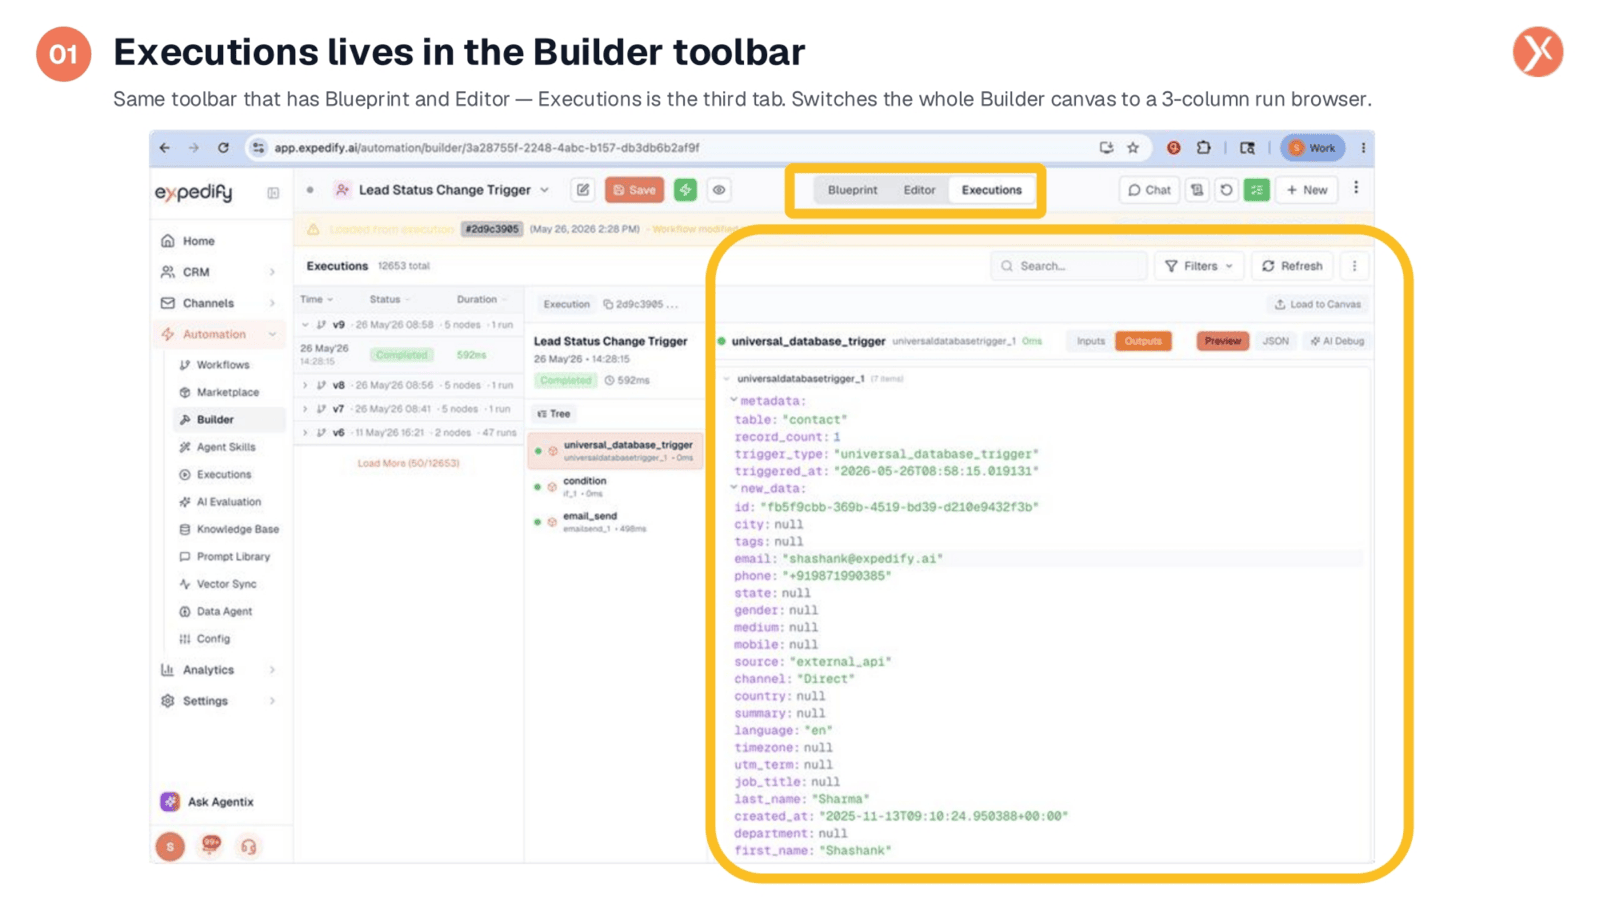
The Executions tab is seamlessly integrated into the Builder toolbar, alongside Blueprint and Editor. Clicking it transforms your workspace into a three-column run browser, dedicated to the selected workflow. This setup provides a clear overview with a run list, a node execution tree, and a detailed pane for each node, all within a focused workflow context.
Left Column: Complete Workflow Execution History
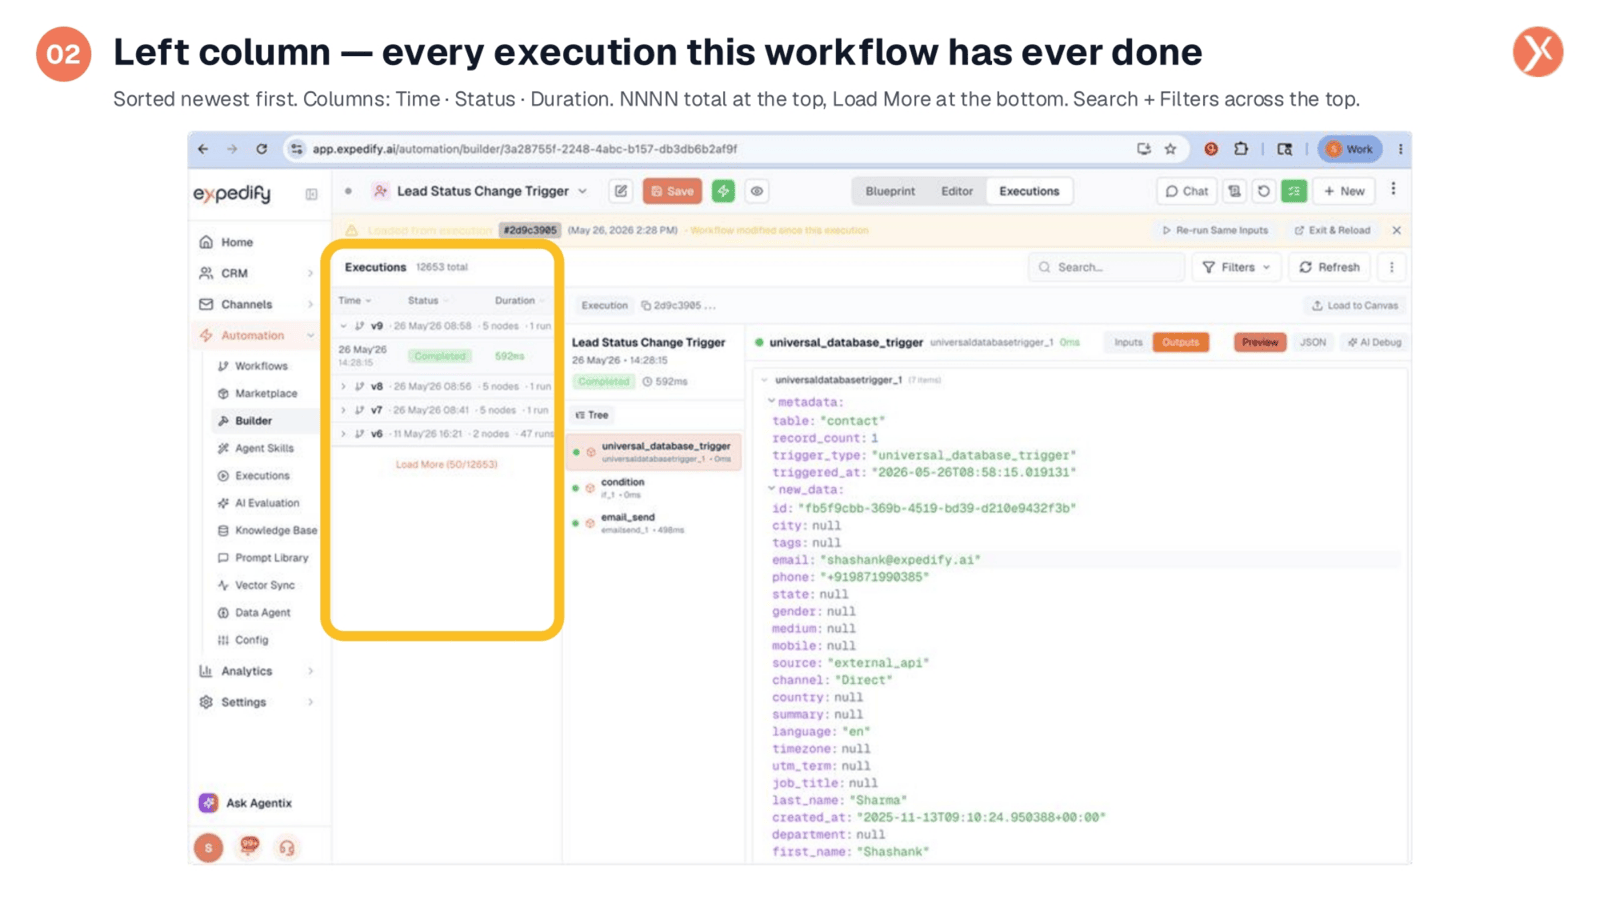
The left column presents a comprehensive list of every execution for the current workflow, sorted from newest to oldest. Each entry displays the execution time, its status, and total duration. You can utilize search and filter options to quickly locate specific runs, and "Load More" handles extensive execution histories, ensuring you can always find the data you need.
Selecting a Run Reveals its Execution Tree
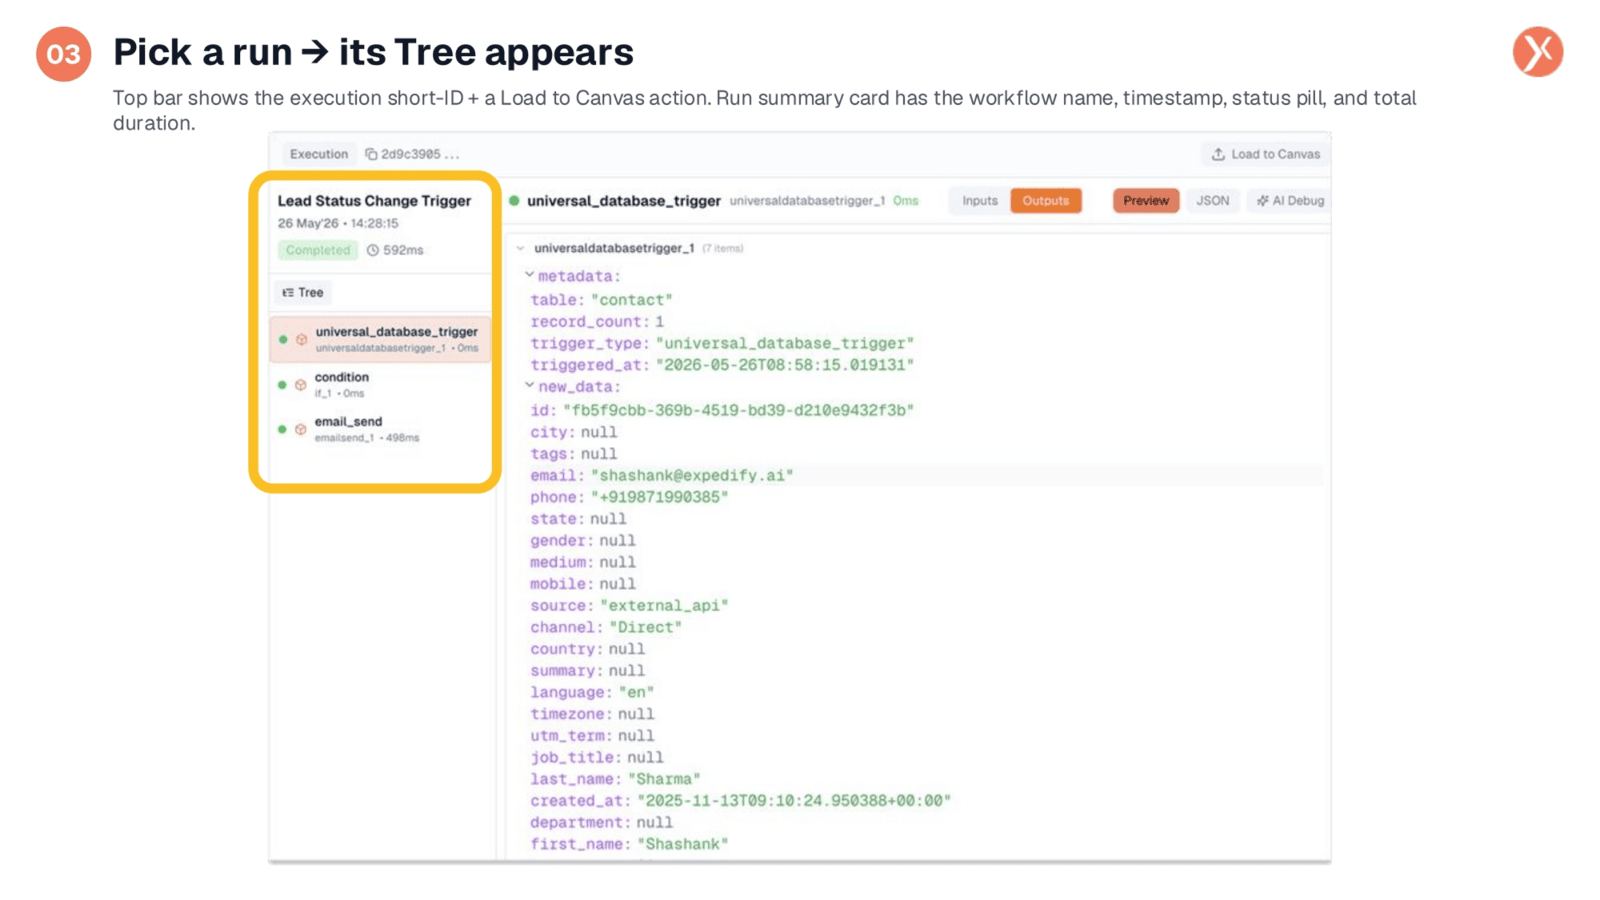
Selecting a run from the list populates the middle column with its execution tree, providing a visual representation of every node that fired. The top bar shows a short ID and a summary card with the workflow name, timestamp, status, and total duration. This tree is collapsible, allowing you to navigate complex workflows and inspect individual nodes like triggers, conditions, and email sends.
Right Column: Per-Node Detail with Five Tabs
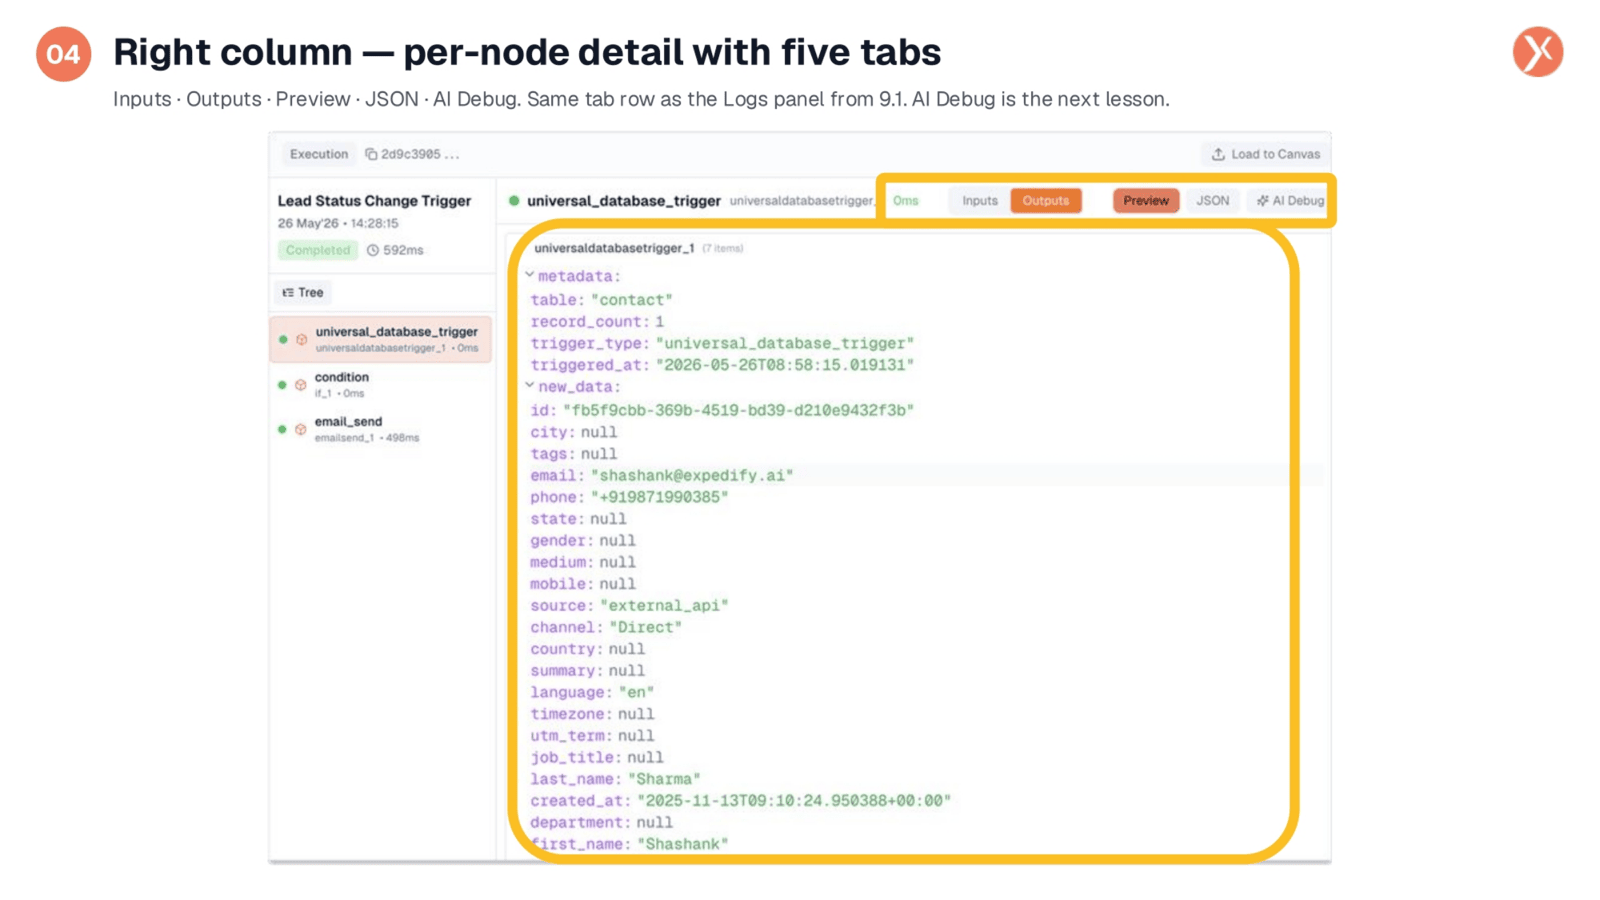
Clicking a node in the execution tree reveals its detailed information in the right column. This pane features five tabs: Inputs, Outputs, Preview, JSON, and AI Debug. Outputs is the default view for completed nodes, while Preview renders outputs like email bodies. The JSON tab provides raw, copy-pasteable data, and AI Debug offers insights into what occurred during the run.
Switch to Inputs to View Data Flow into a Node
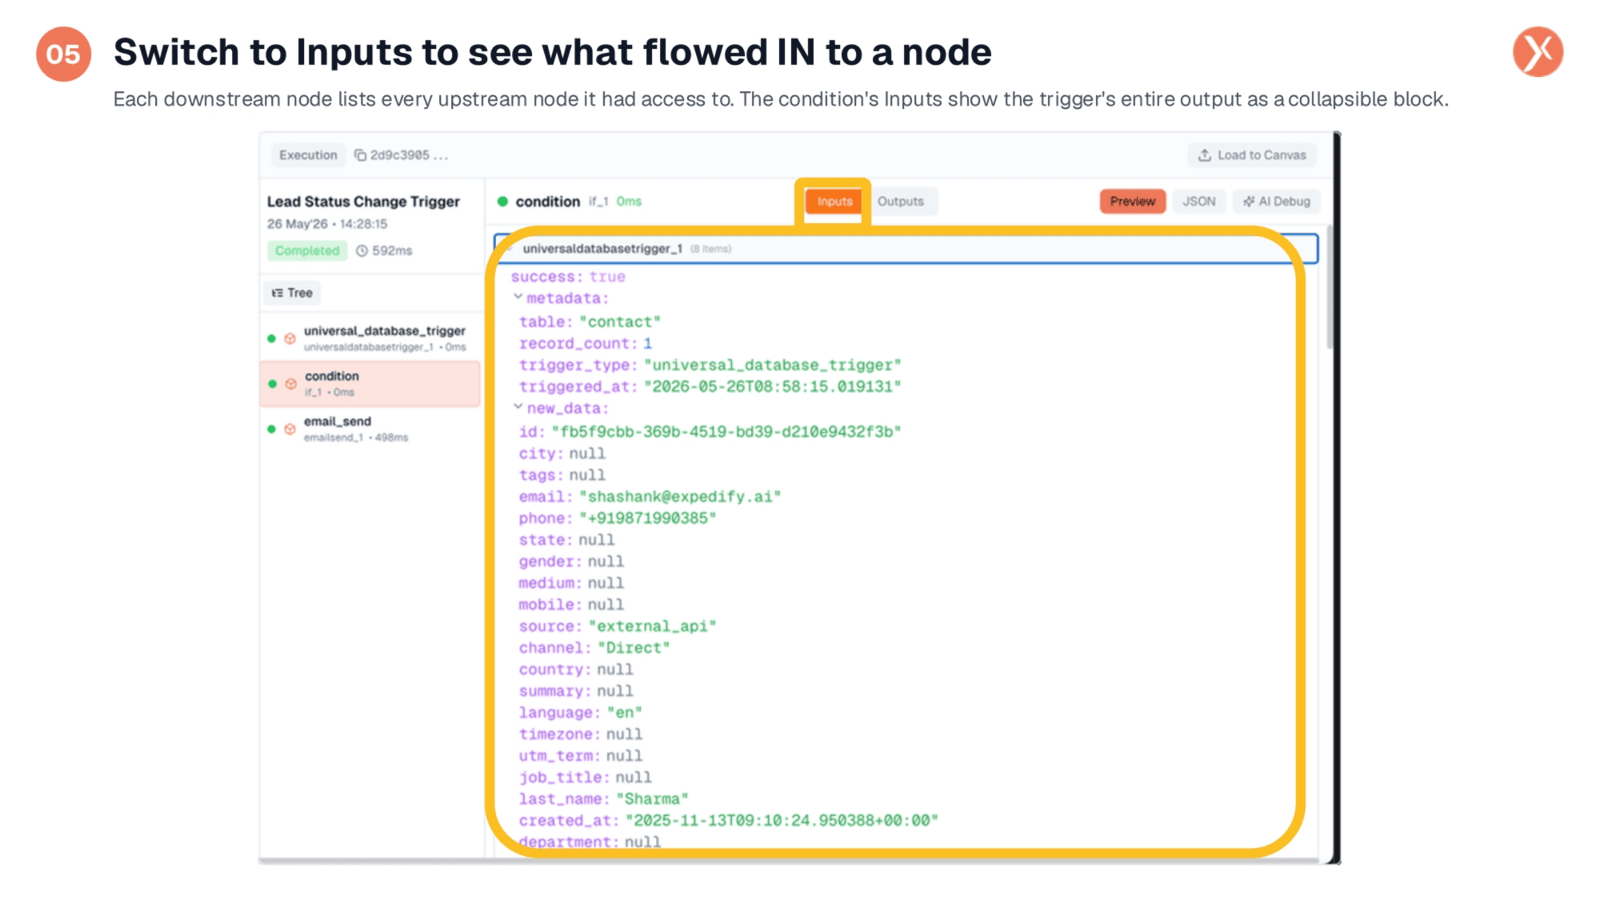
To understand the data flowing into a specific node, simply select the node in the tree and switch to the Inputs tab in the right pane. This view displays the entire output from all upstream nodes as collapsible blocks. For instance, expanding the universaldatabasetrigger_1 block reveals the full contact record that initiated the trigger, illustrating precisely what data the node processed.
Click-to-Copy Any Variable for Easy Reuse
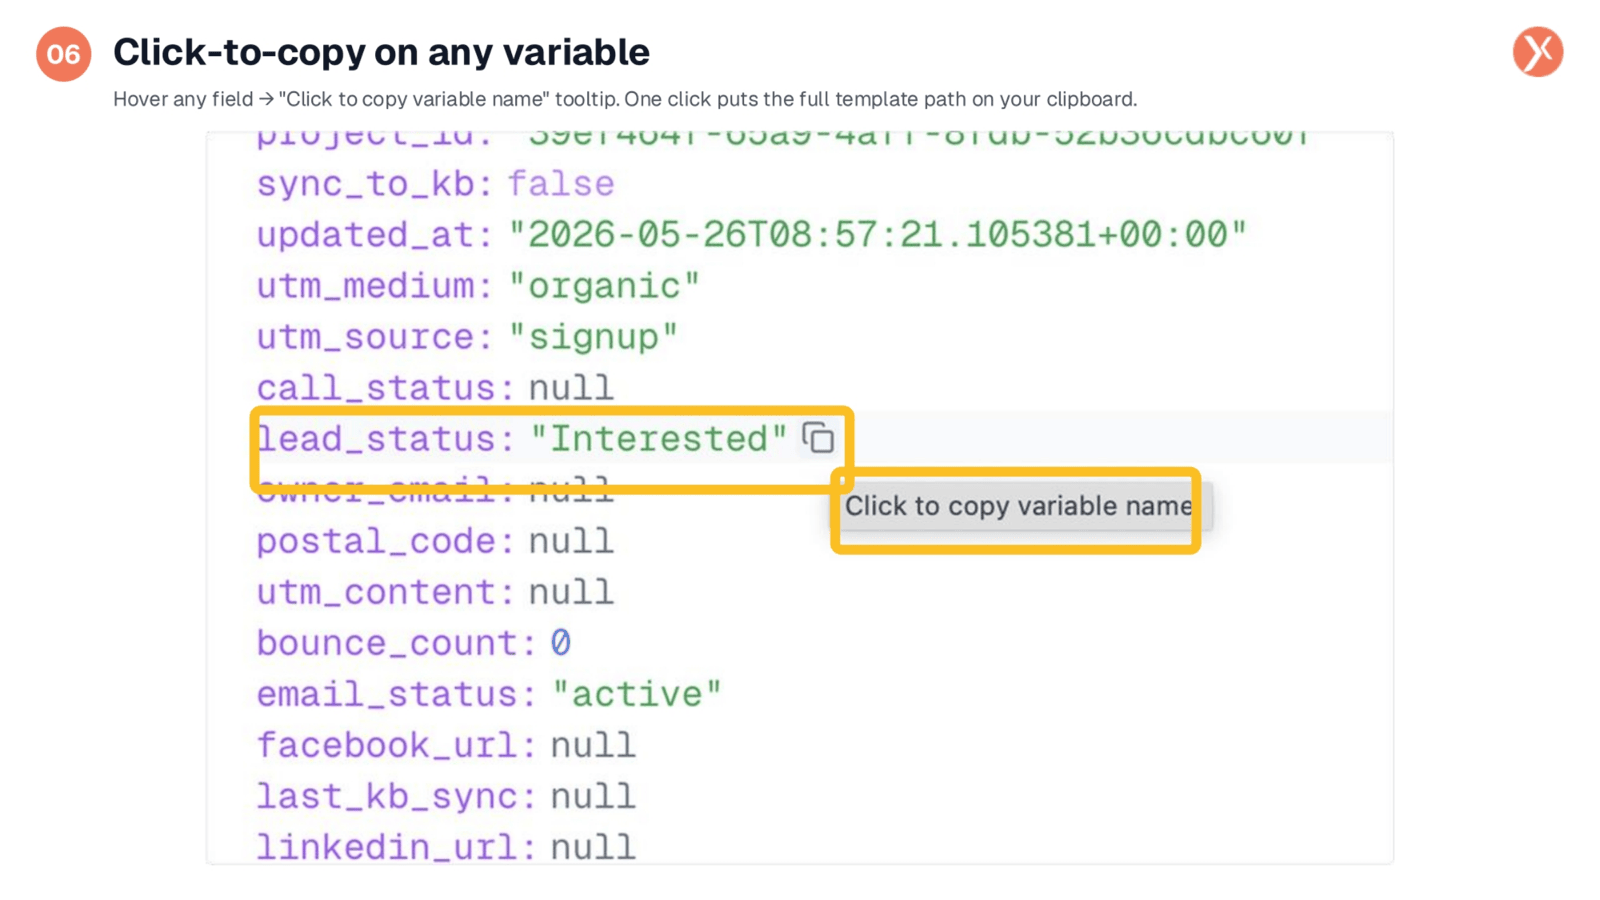
The detail pane offers a convenient click-to-copy feature for any variable. Hovering over a field displays a tooltip, and a single click copies its full template path directly to your clipboard. This allows you to easily paste the variable into any downstream node, streamlining the process of wiring data within your workflow, regardless of when the run occurred.
Load to Canvas: Replay Past Run Values in Editor
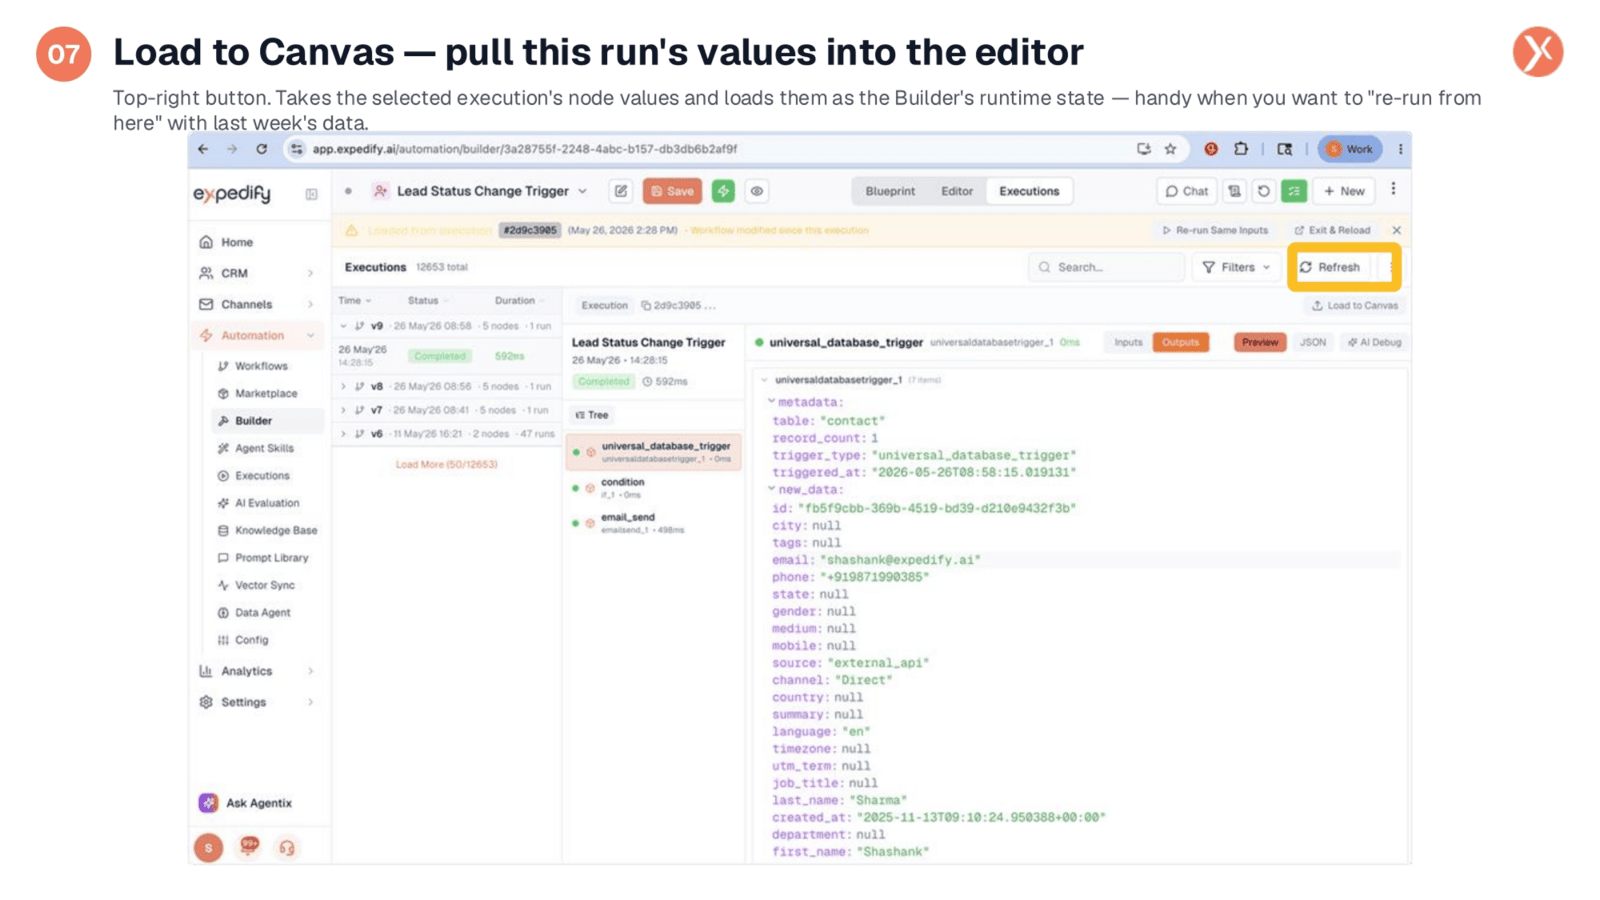
The "Load to Canvas" button, located in the top-right of the execution pane, is a powerful replay tool. Clicking it loads the selected run's node values directly into the Builder's runtime state. This enables you to switch back to the Editor and inspect or re-run from a specific point with those exact historical values, facilitating debugging without re-firing the original trigger event.
Comparing Run-Inspection Surfaces: Logs, Executions, NCP
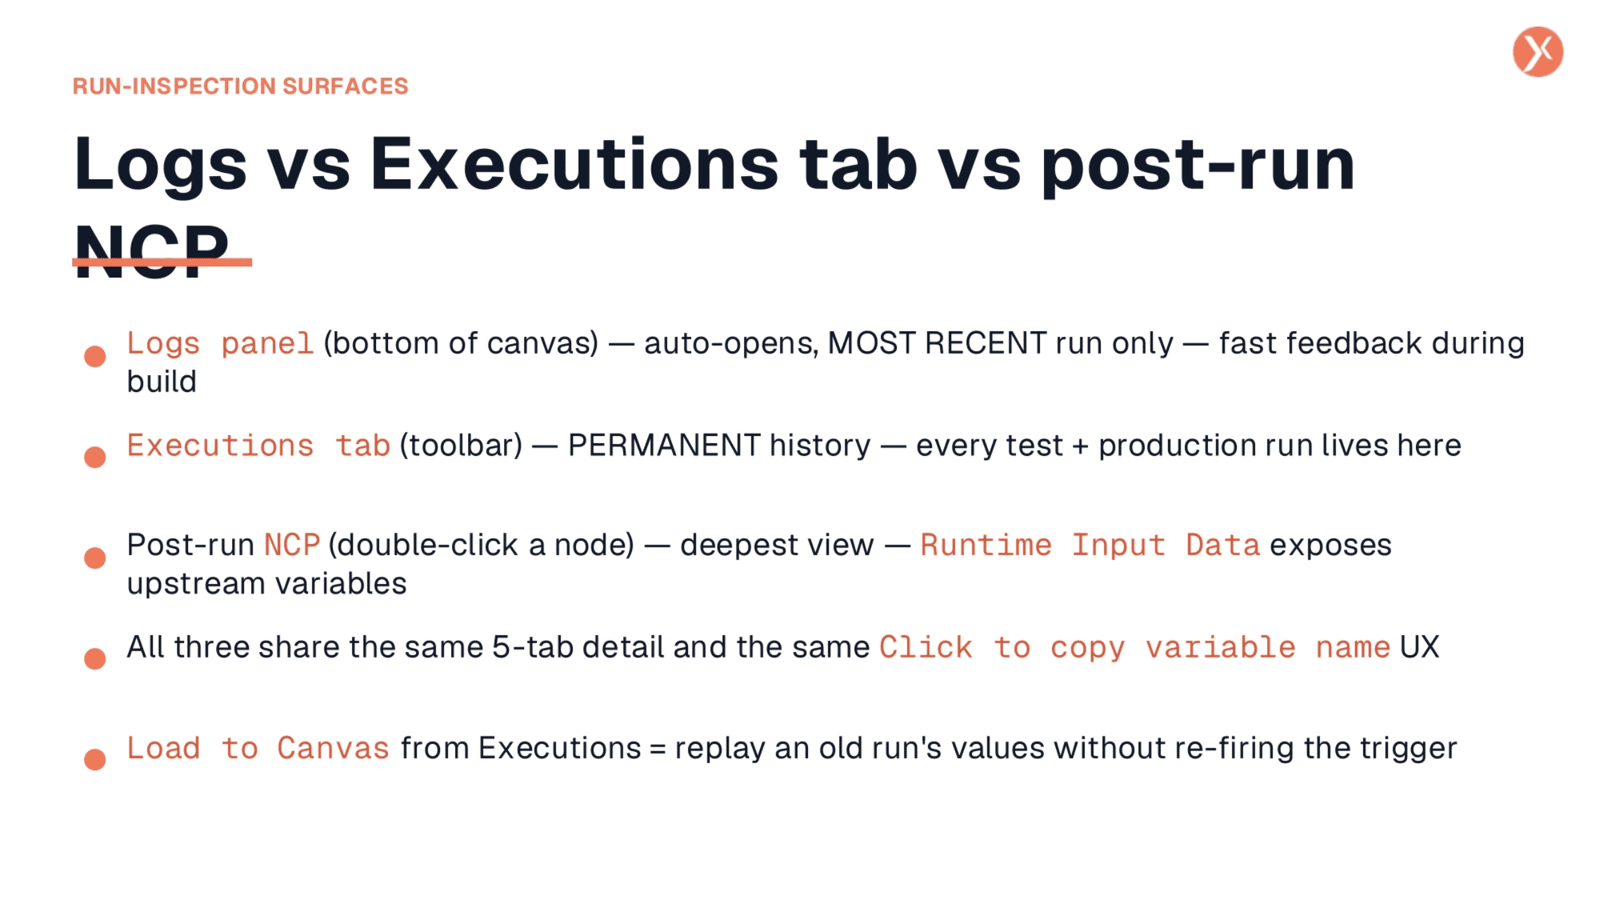
Expedify offers three key surfaces for run inspection. The Logs panel provides immediate feedback for the most recent run during active building. The Executions tab offers a permanent, searchable history of all workflow runs for debugging past issues. For the deepest single-node view, double-clicking a node on the canvas after a run reveals its Runtime Input Data. All three share the same detailed tabs and copy-to-clipboard functionality.
Recap: Same Data, Three Places It Lives
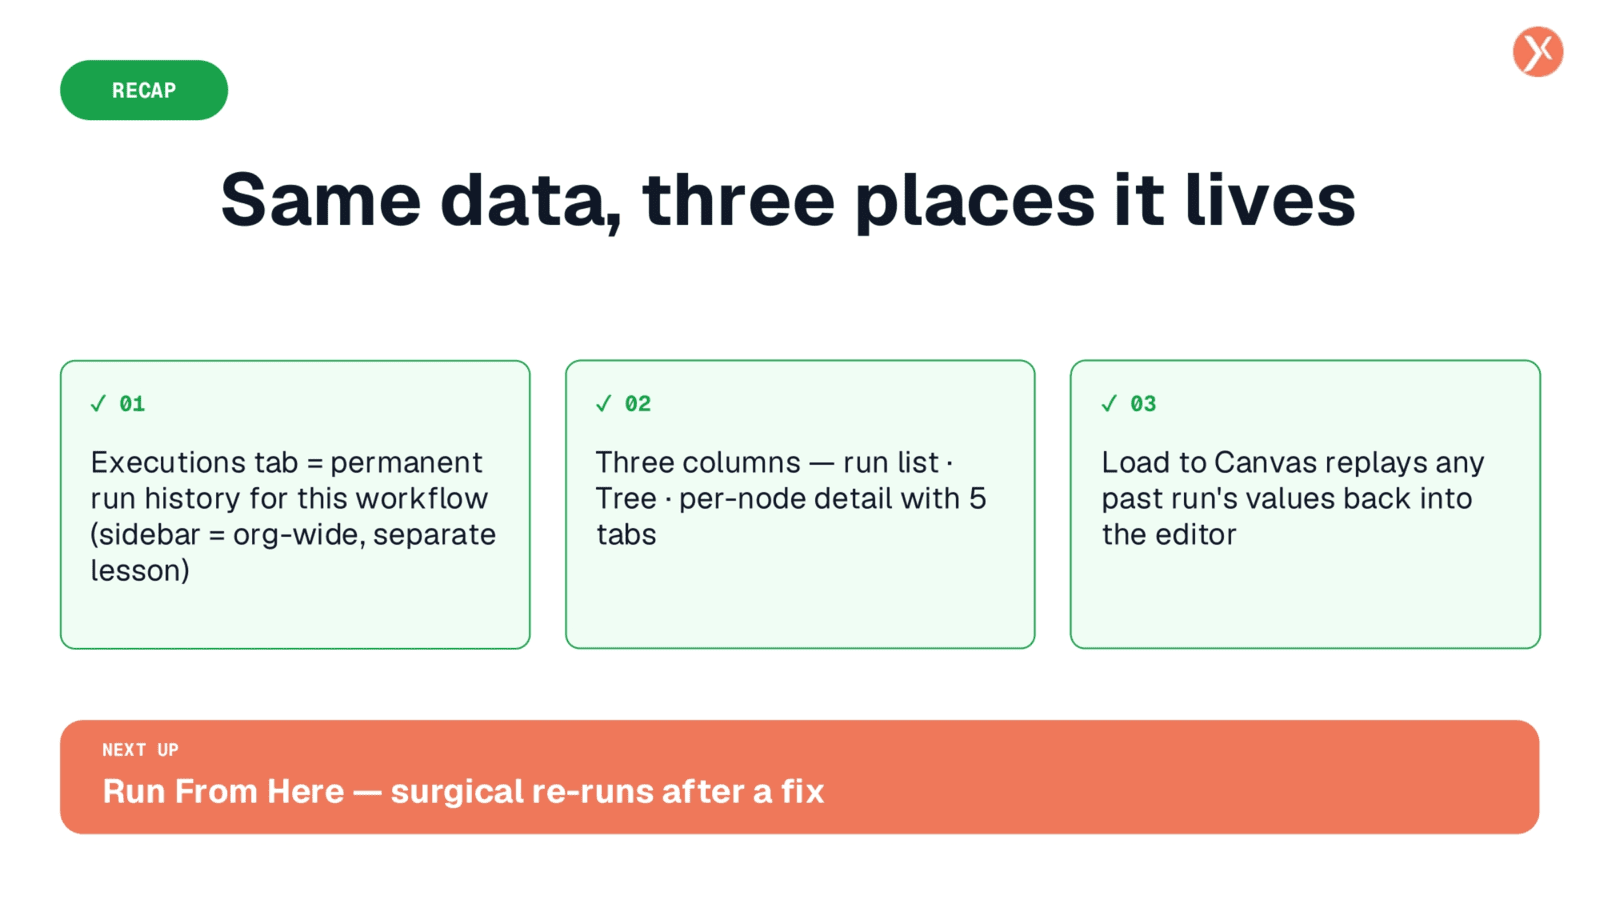
The Executions tab acts as a comprehensive flight recorder for your workflows, presenting run history, execution trees, and detailed node information across three columns. It utilizes the familiar Inputs, Outputs, Preview, and JSON tabs for thorough data inspection. Next, we'll explore "Run From Here," a surgical re-run feature that allows you to verify fixes efficiently without re-executing the entire workflow.