Testing in the Builder
This presentation focuses on effectively testing workflows within the Expedify Builder. We'll explore how to run a workflow before deployment, ensuring it functions as expected. The goal is to validate your automation logic in a real-world scenario.
The Test Loop: Fire and Inspect
The core of our testing strategy is the test loop: fire it for real, then inspect the results. This involves changing a record to trigger the workflow, observing every node turn green, and then using the Logs panel and post-run Node Configuration Panels to inspect the details of the execution.
Five Nodes, Ready to Fire
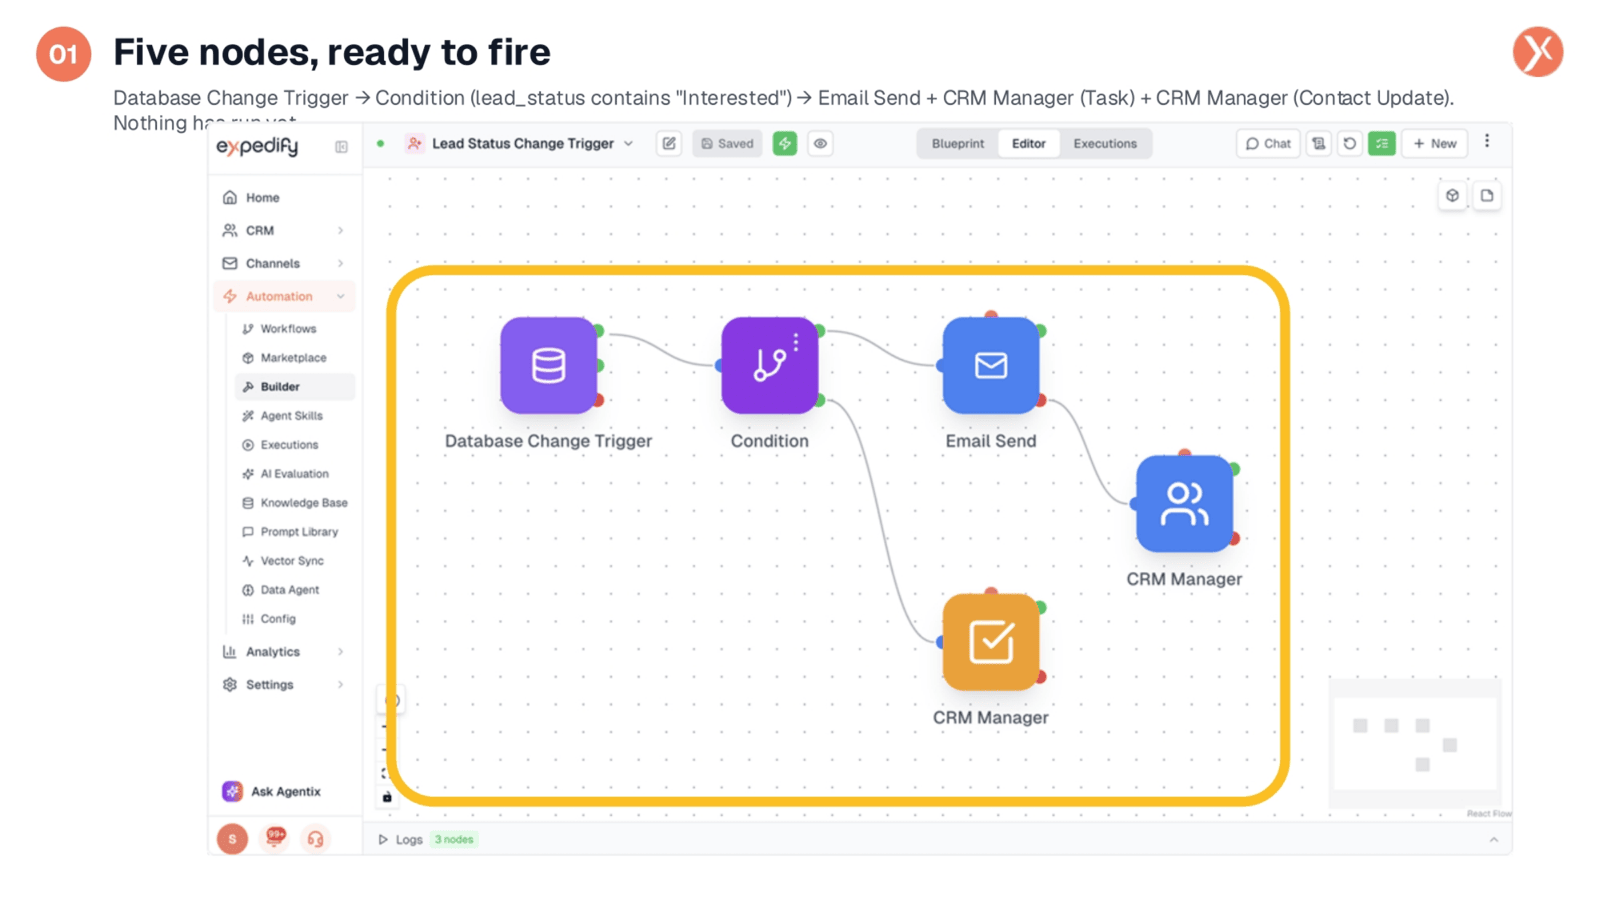
We'll begin with our Lead Status Change workflow, comprising five interconnected nodes. This workflow triggers when a contact's lead status changes, then conditionally sends an email and updates CRM tasks. Currently, all nodes are in a neutral state, awaiting activation.
Fire the Trigger by Changing a Real Record
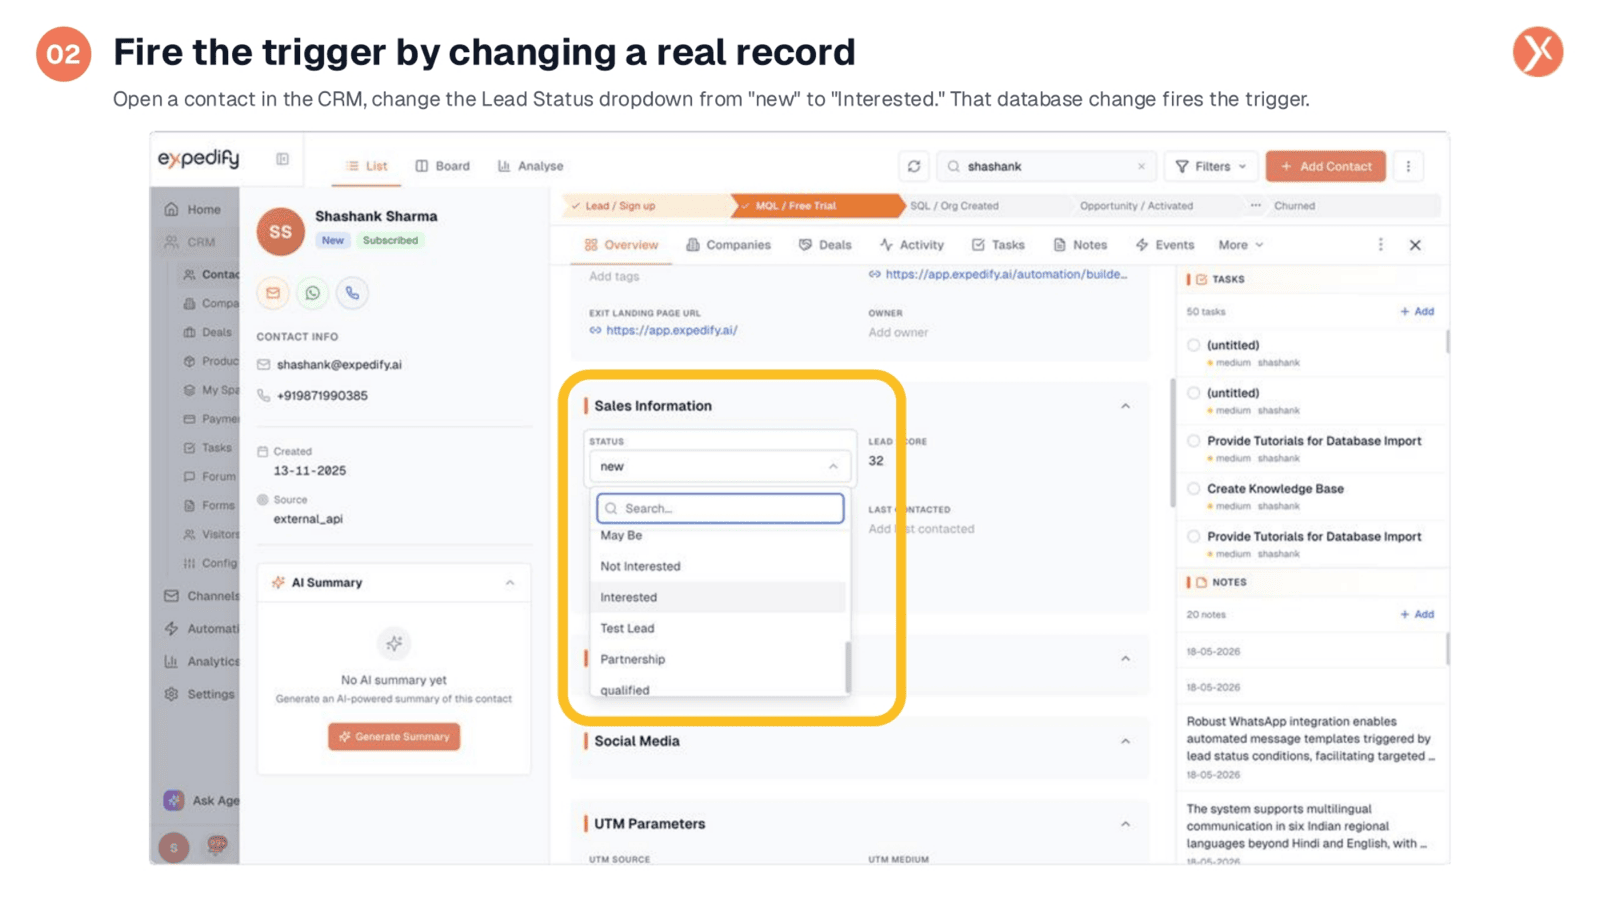
To test a database trigger, you must initiate a real database event. We'll open a contact in the CRM, navigate to the Sales Information section, and change the Lead Status dropdown from 'new' to 'Interested.' This action will fire the Database Change Trigger, initiating the workflow.
Every Node Completed
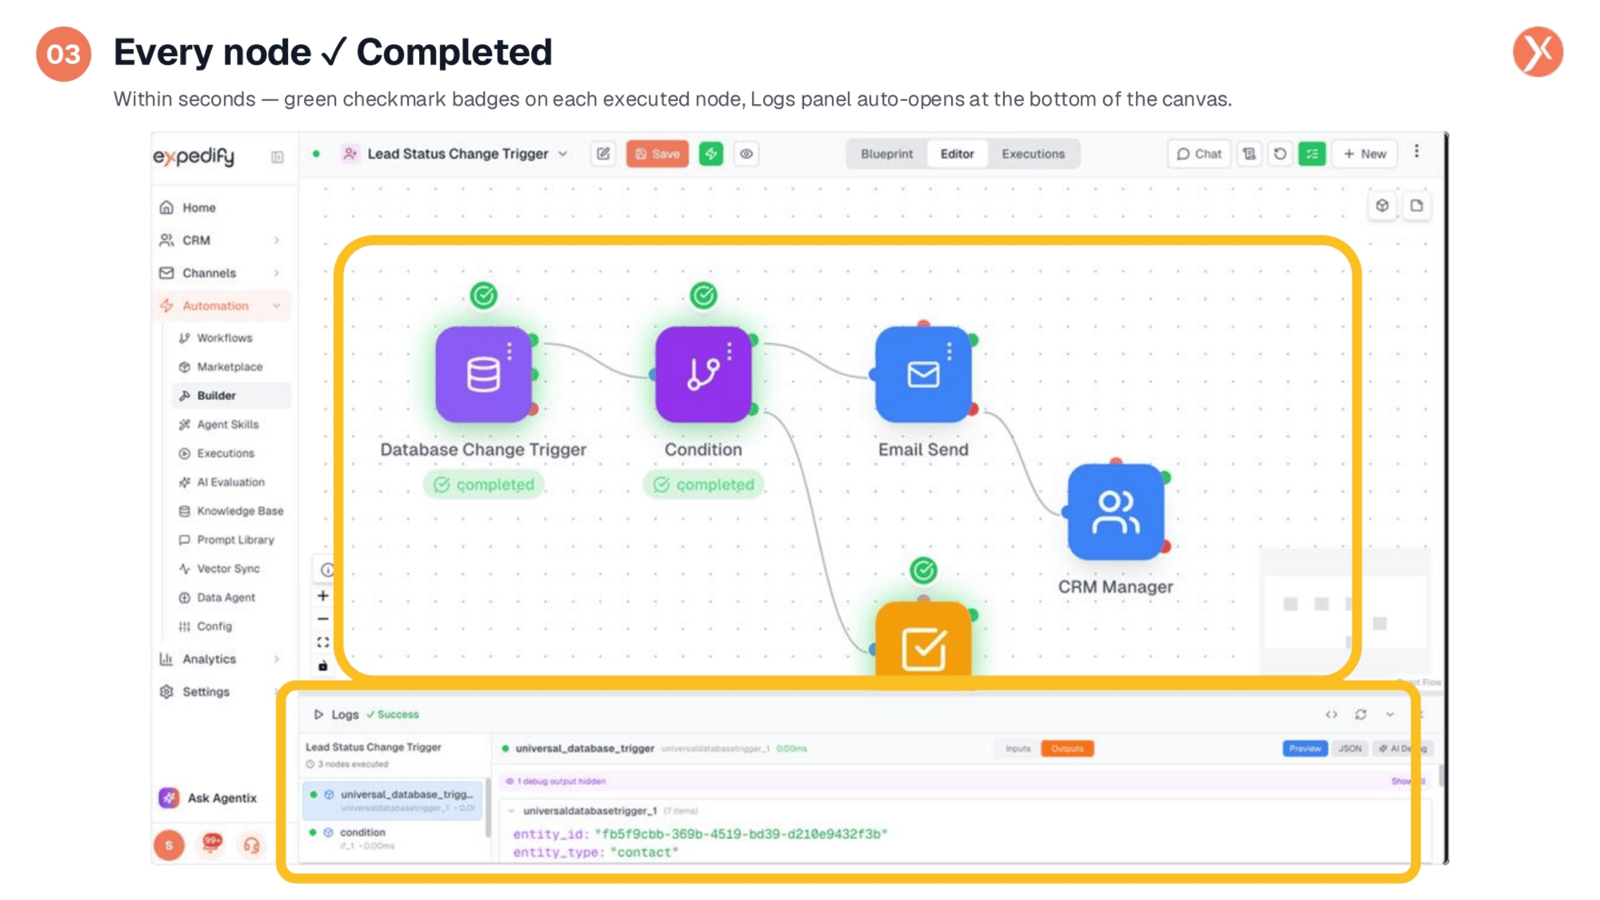
Upon returning to the Builder, you'll observe that every node now displays a green 'Completed' badge, indicating a successful execution. Simultaneously, the Logs panel automatically opens at the bottom of the canvas, providing an immediate overview of the workflow's run, which typically completes in under a second.
The Logs Panel: Three Panes
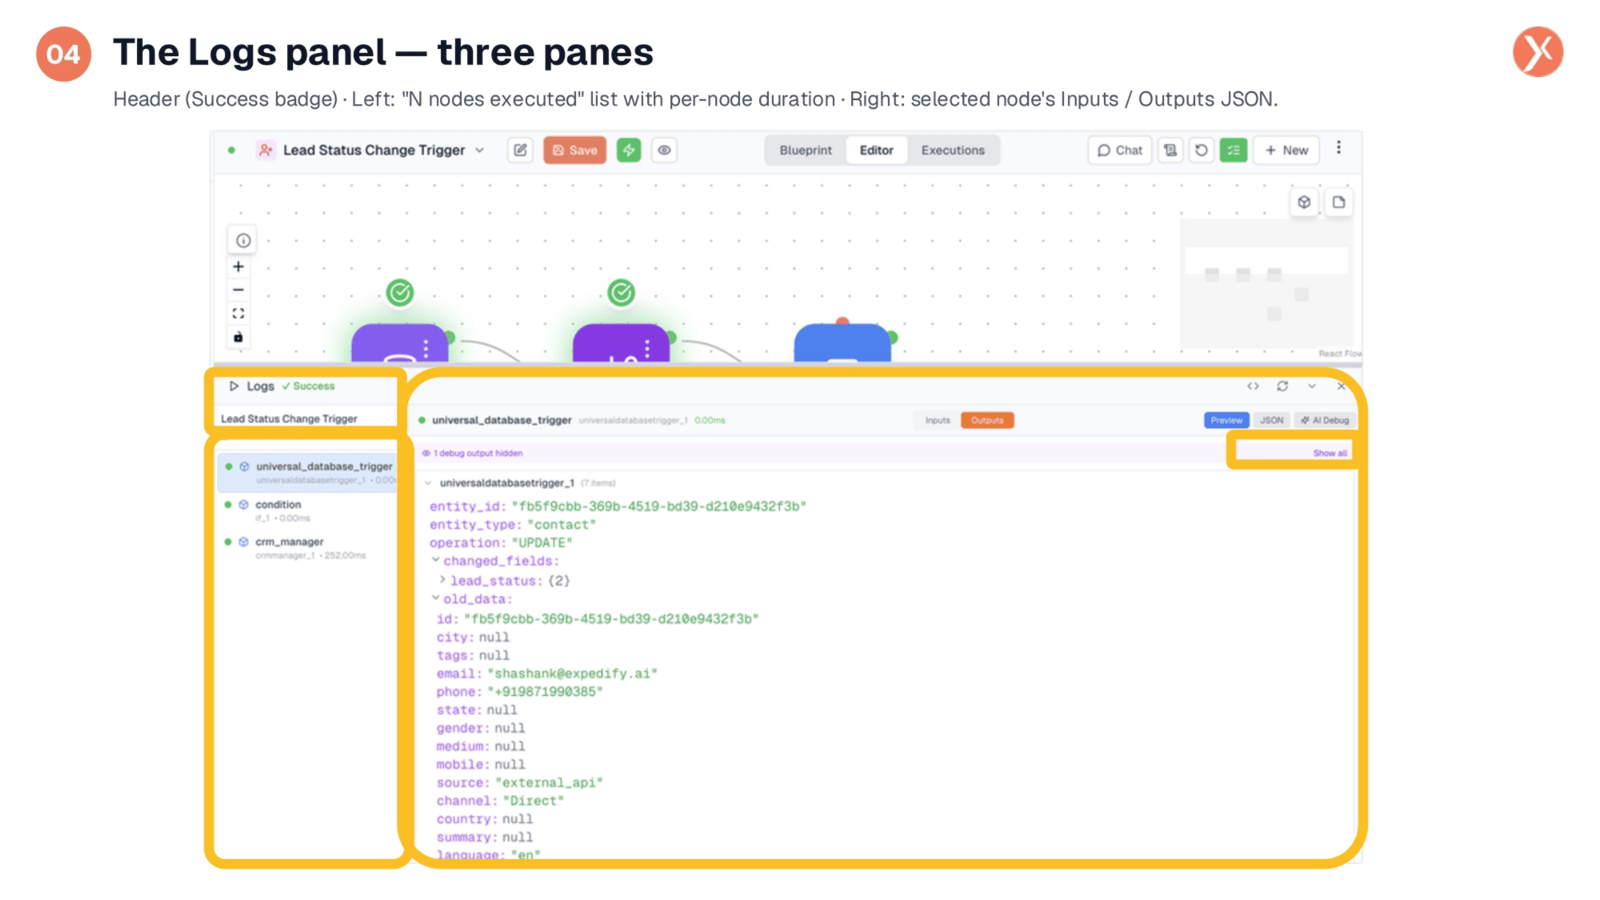
The Logs panel serves as our primary inspection surface, structured into three distinct regions. The header displays a 'Success' badge, while the left column lists every executed node with its duration. The right pane dynamically shows the inputs and outputs of the node selected from the left list, offering various views like Preview and JSON.
Trigger Output: What Fired This Run
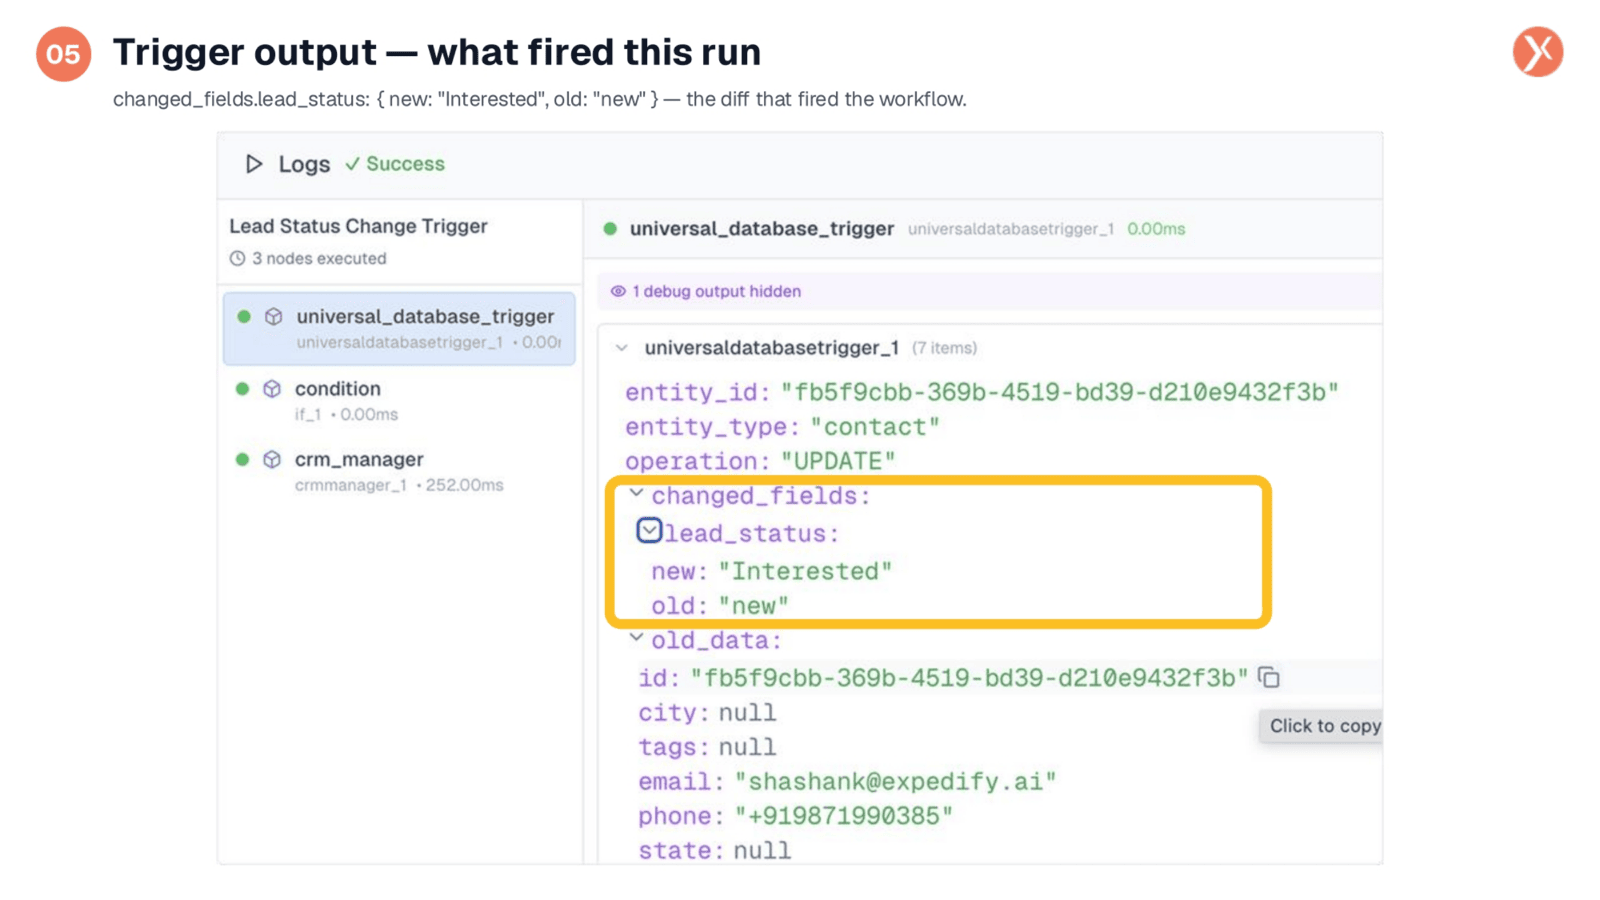
By selecting the 'universal_database_trigger' in the Logs panel, the right pane reveals its output. This includes the entity ID of the changed contact, the 'UPDATE' operation, and the specific 'changed_fields.' This 'diff' clearly shows that the 'lead_status' transitioned from 'new' to 'Interested,' explaining precisely why the workflow was initiated.
Condition Output: The Comparison
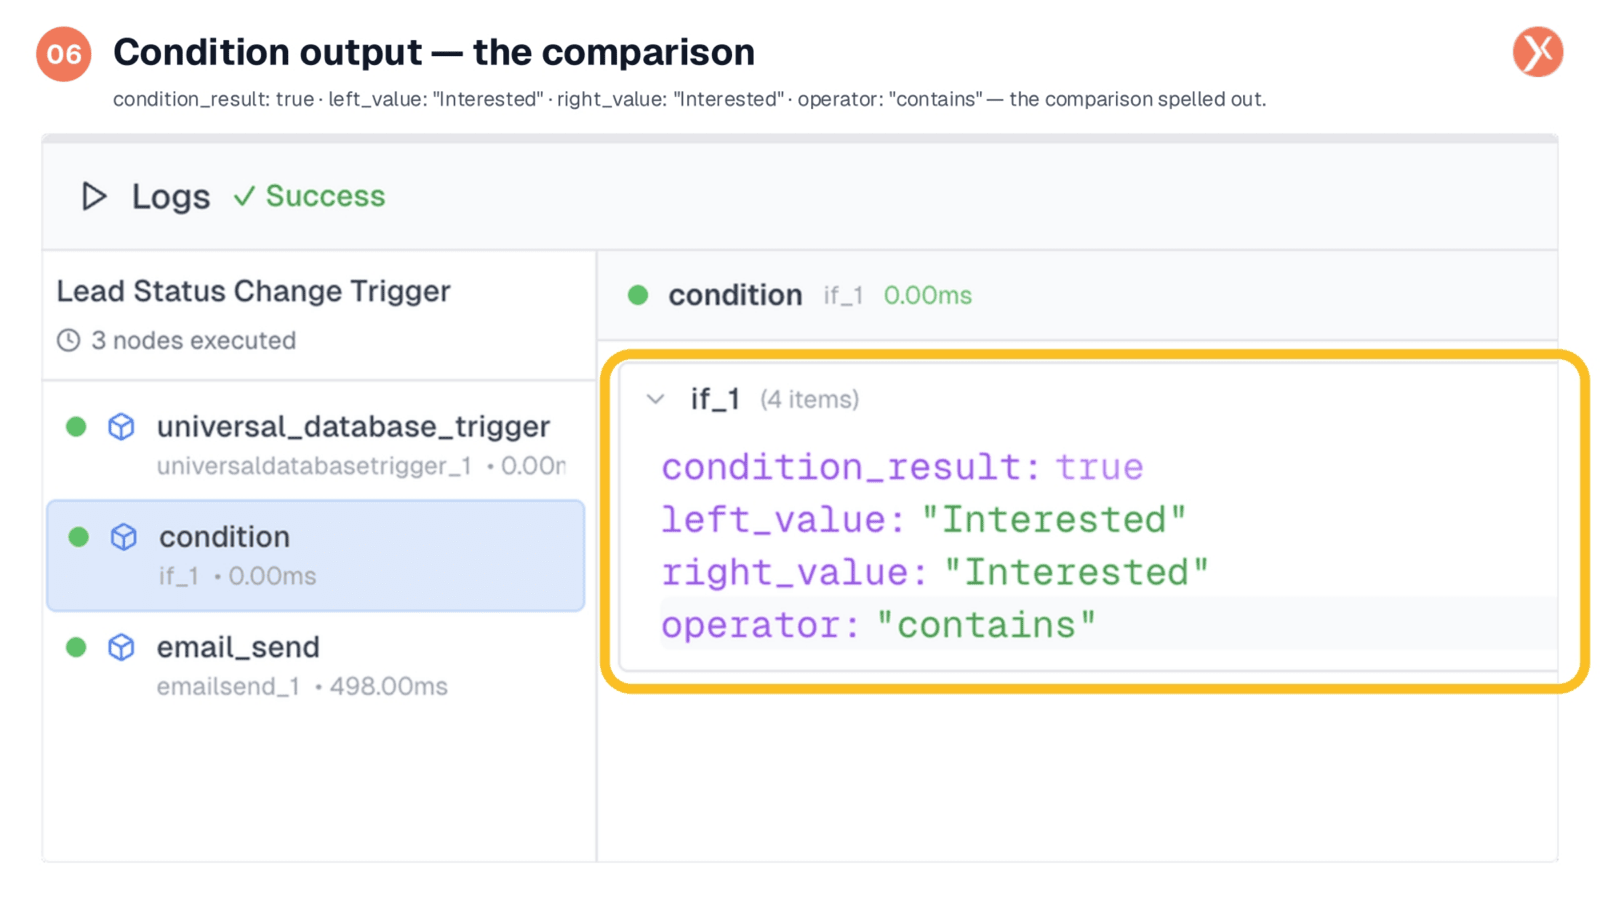
Inspecting the 'condition' node's output in the Logs panel provides insight into the comparison performed. It displays the 'left_value' (the resolved variable), the 'right_value' (our configured value), and the 'contains' operator. Crucially, the 'condition_result' is 'true,' confirming that the filter passed and the workflow proceeded down the 'true' branch.
Email Send Output: What Got Sent
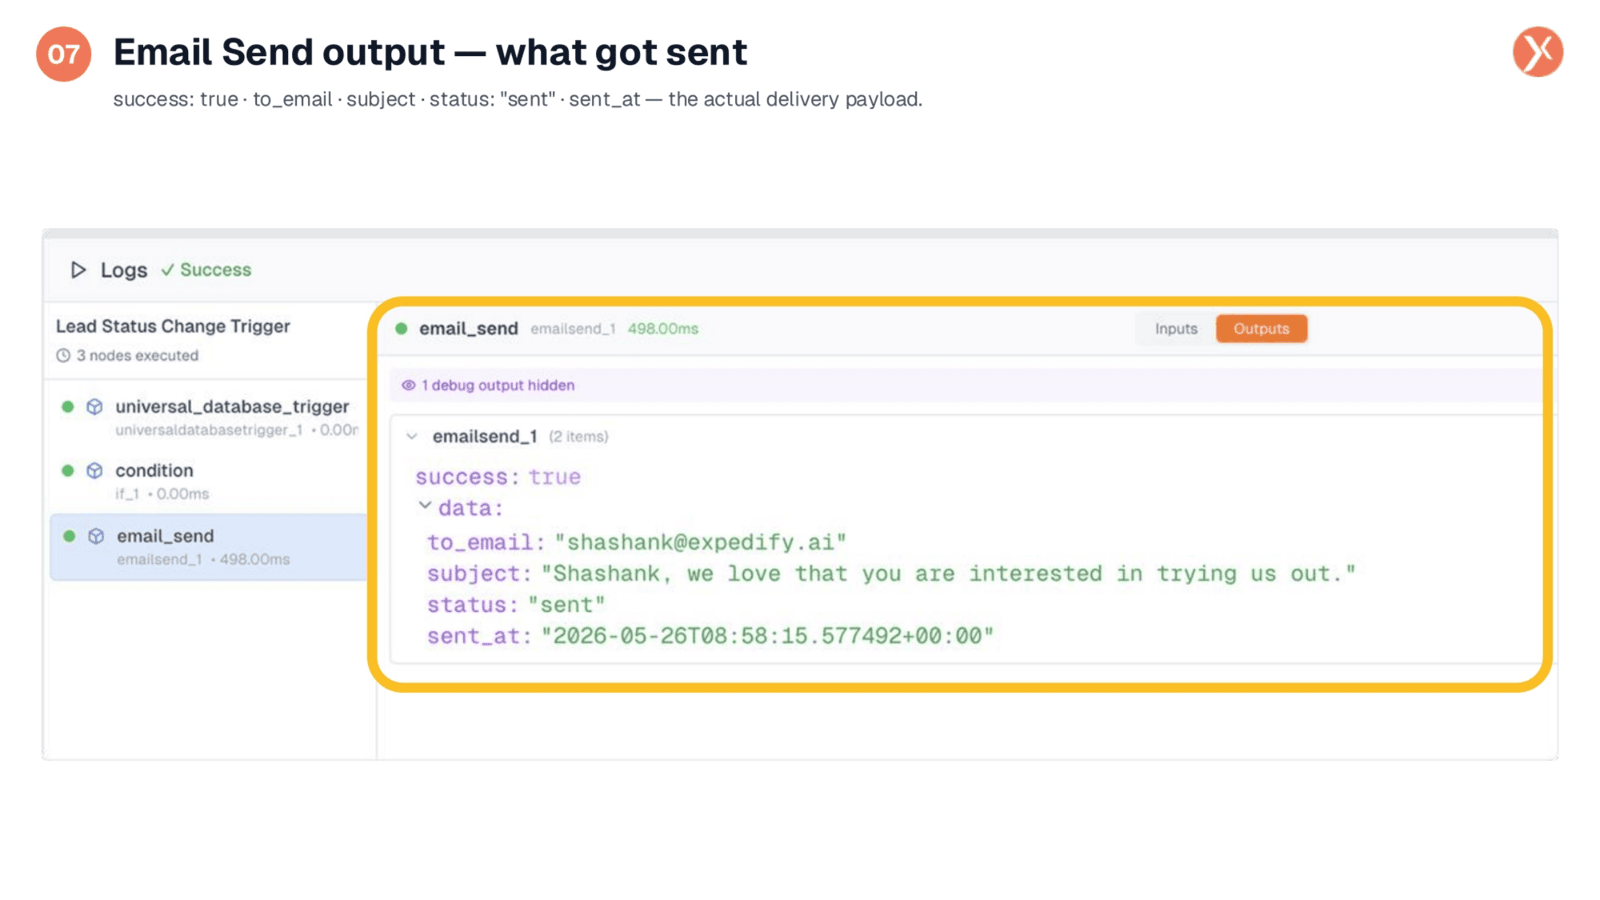
Reviewing the 'email_send' node's output confirms the email's delivery details. The right pane shows the recipient's email address, the subject line with the resolved template variable, and a 'sent' status with an ISO timestamp. This output, along with the execution duration, provides confidence that the email was successfully dispatched.
The Email Actually Landed
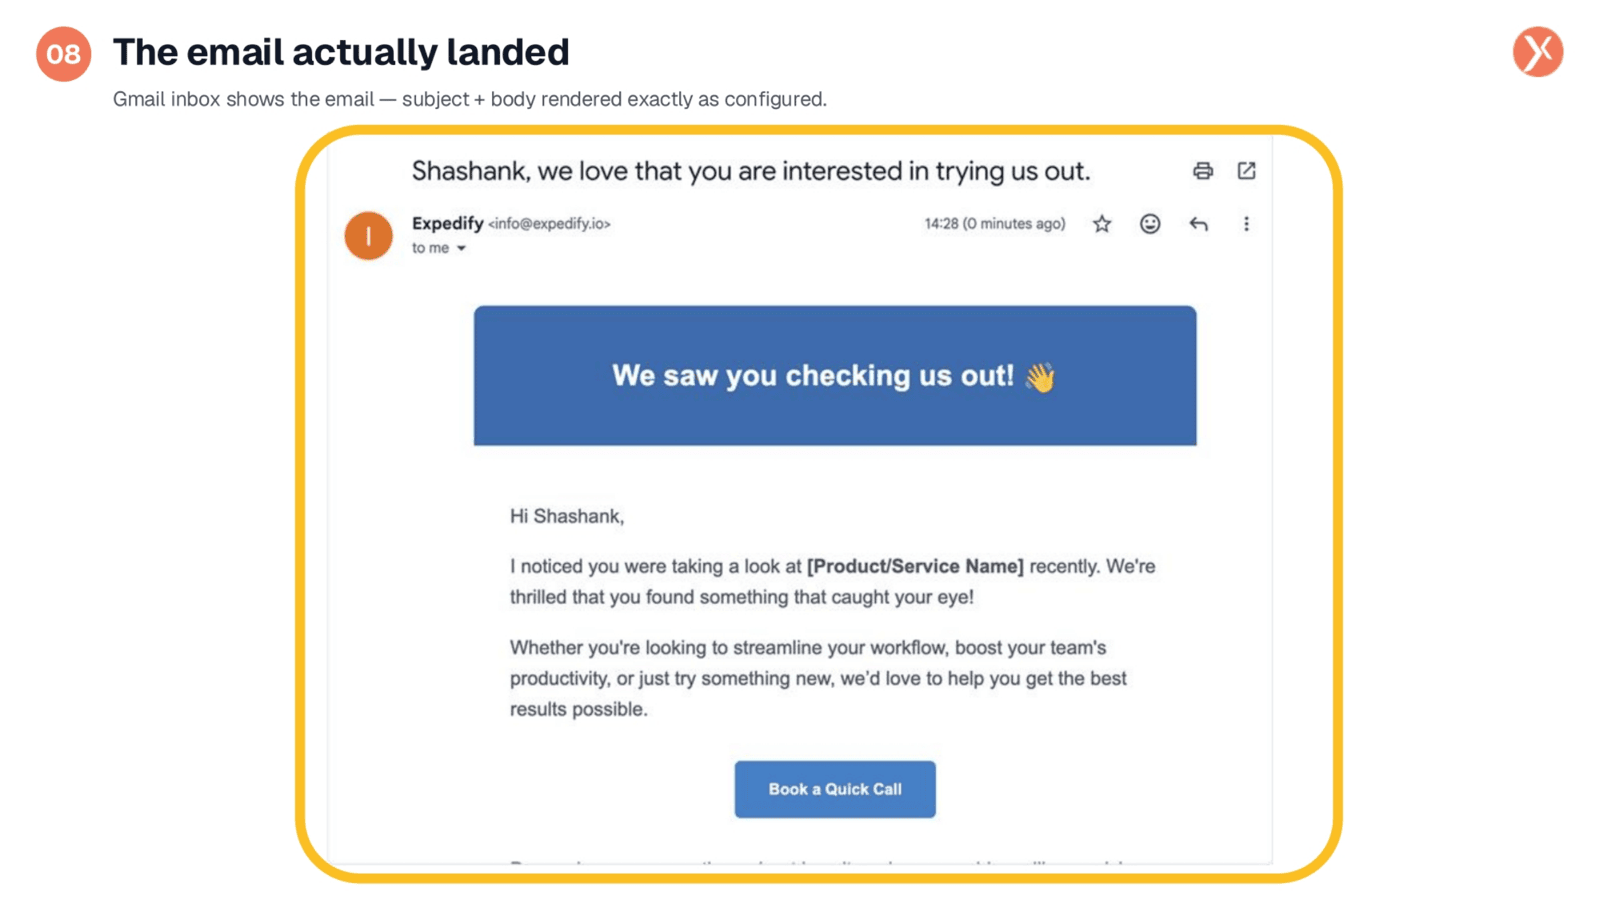
To fully verify the email's journey, we check the recipient's Gmail inbox. The email is present, with the subject line matching the Logs panel output. The HTML template is fully rendered, personalized to Shashank, confirming that the trigger, condition, and email send all functioned correctly, delivering the message as intended.
Double-Click Any Node for the Second Angle
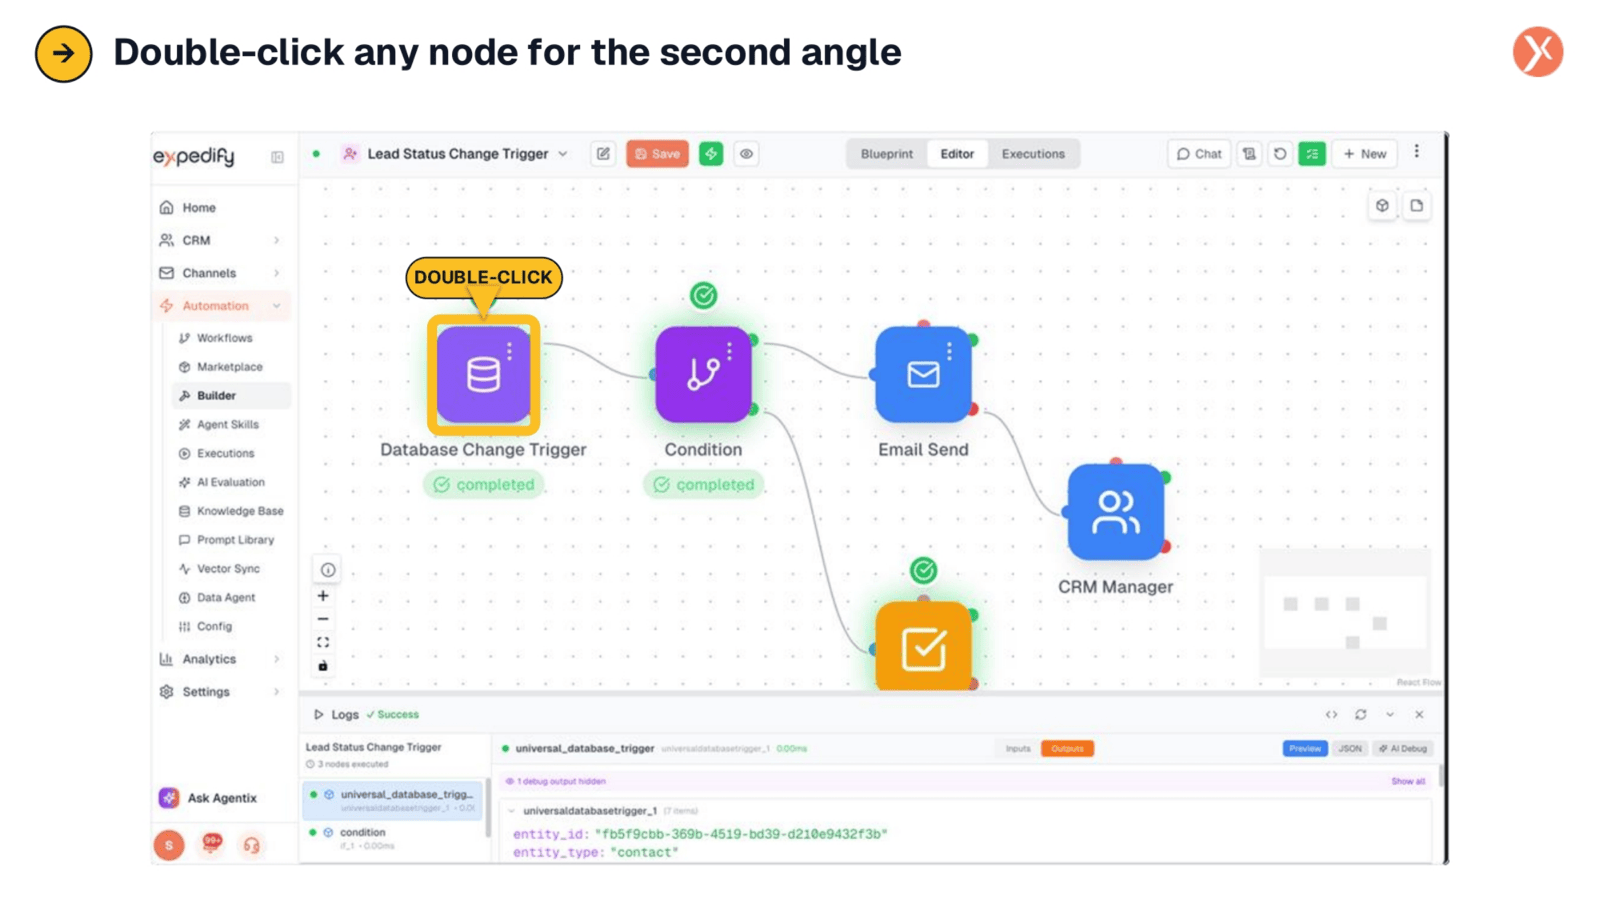
Beyond the Logs panel, our second inspection method involves double-clicking any node on the canvas. After a workflow run, the node's configuration panel transforms to display everything that occurred internally, including variables that can be easily copied for reuse in downstream nodes.
Post-Run NCP: Status Flips to Completed
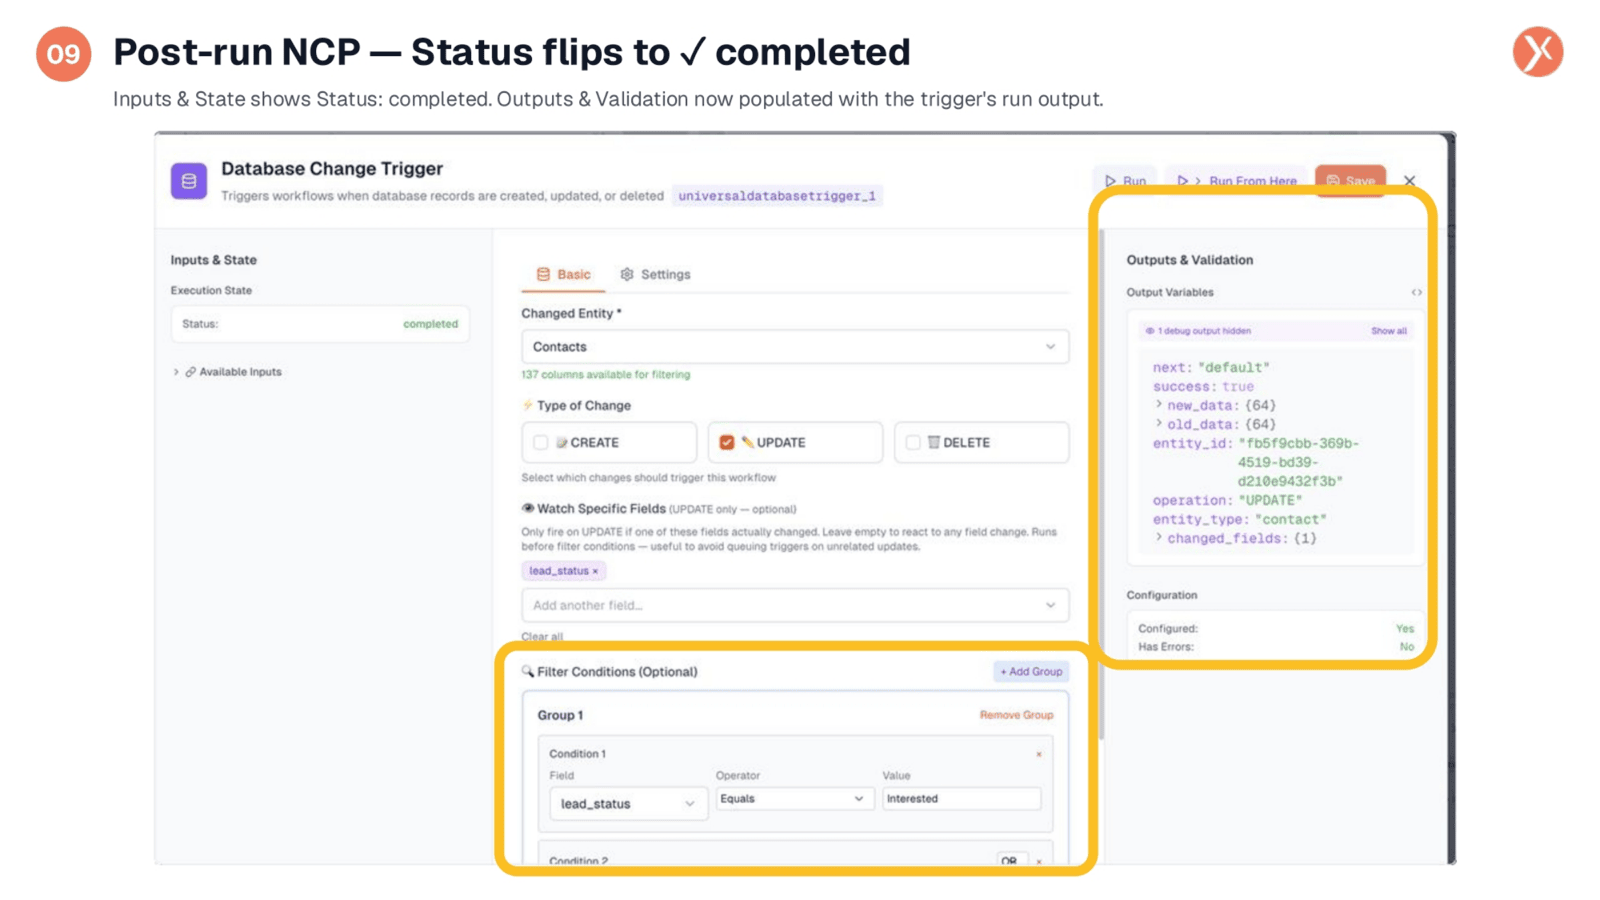
When you double-click a node after a run, its Node Configuration Panel (NCP) shows a 'completed' status in green. The 'Outputs and Validation' section, previously empty, is now populated with the trigger's actual output, such as the contact's entity ID and changed fields. This view confirms the node's health and successful execution.
Downstream Nodes Get a Runtime Input Data Section
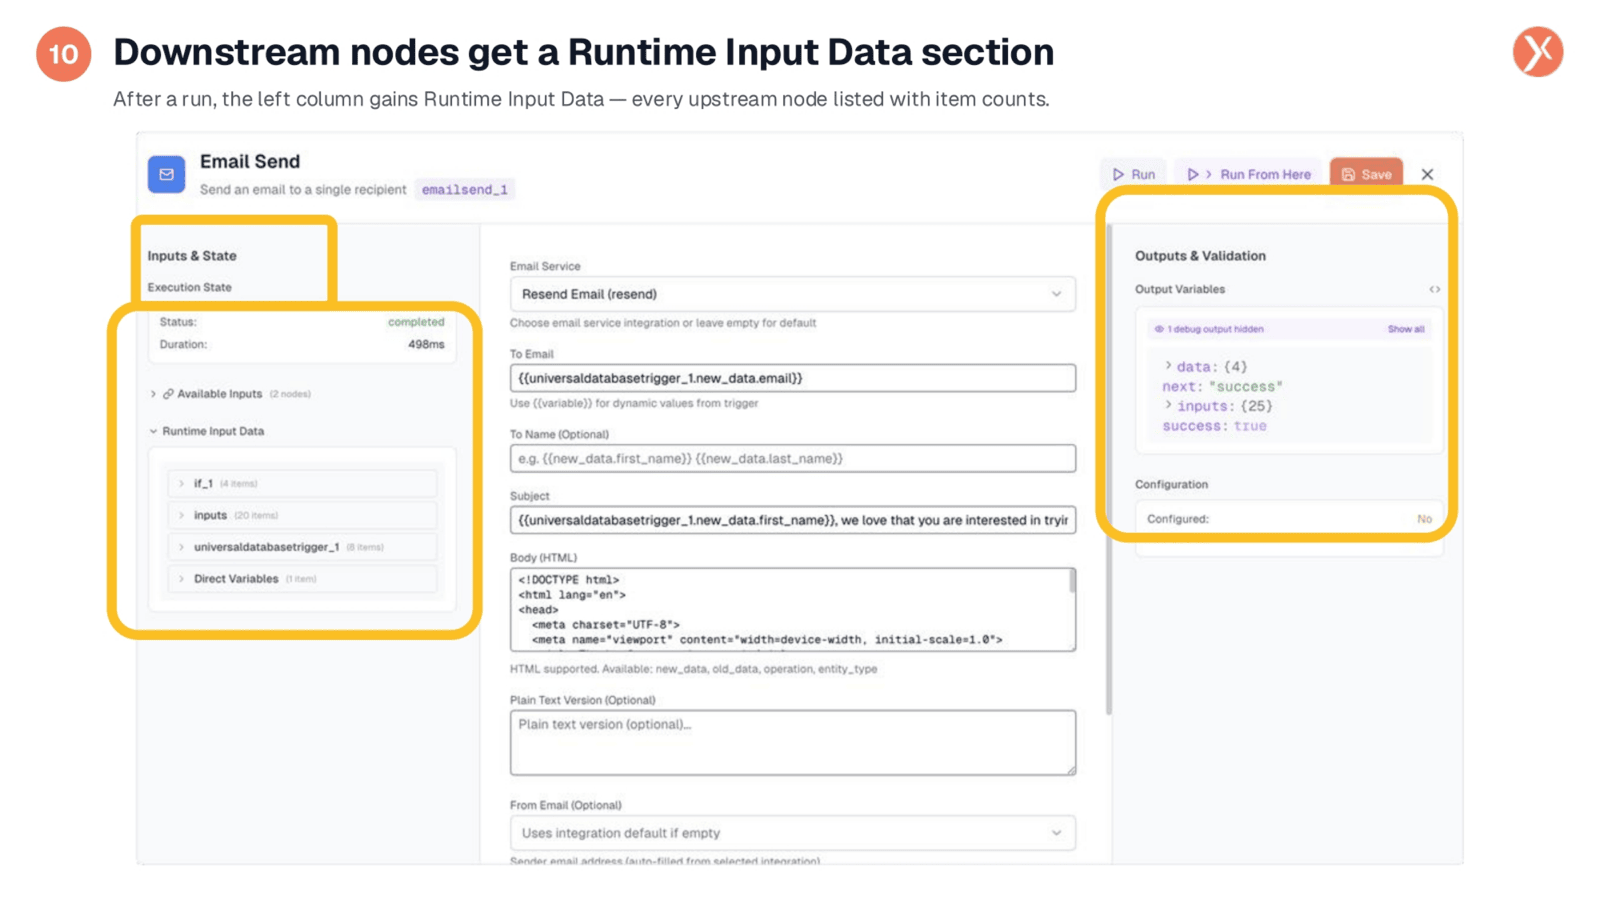
After a workflow executes, downstream nodes gain a new 'Runtime Input Data' section in their configuration panel. This section lists every upstream node that provided data, along with item counts. It's a crucial layout for inspecting the exact values passed between nodes during the actual run.
Click to Copy Any Upstream Variable
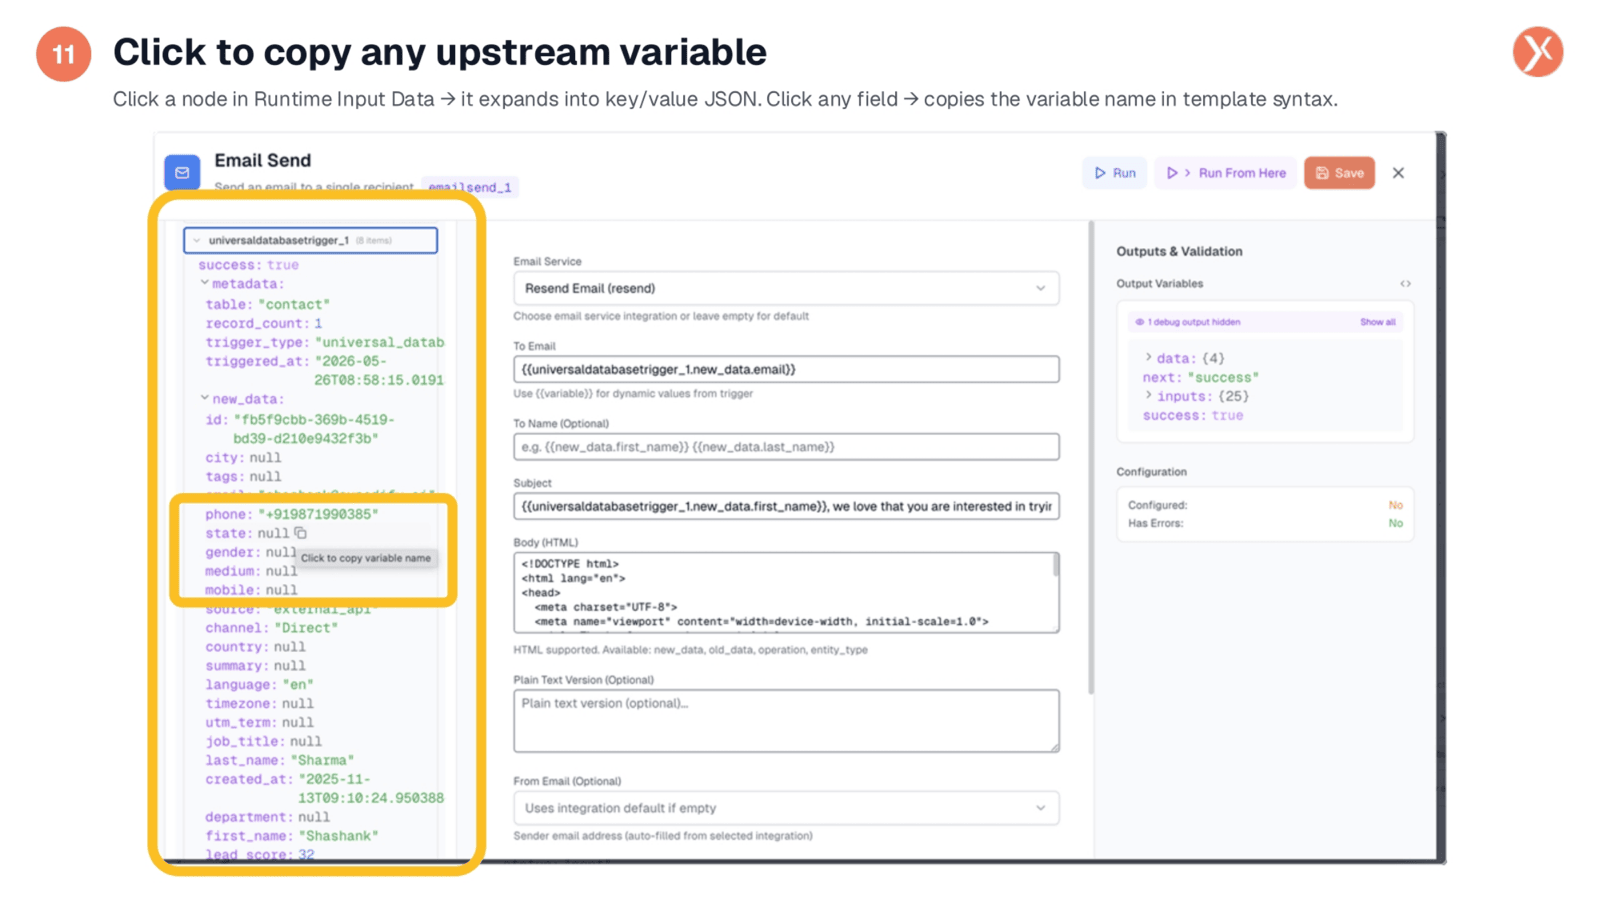
Expanding any upstream node within the 'Runtime Input Data' section reveals its real runtime values, such as 'first_name: Shashank' or 'email: shashank@expedify.ai.' Hovering over any field displays a 'Click to copy variable name' tooltip. This feature allows you to instantly copy the template syntax for that variable, streamlining the process of wiring subsequent nodes.
Read Every Run Two Ways
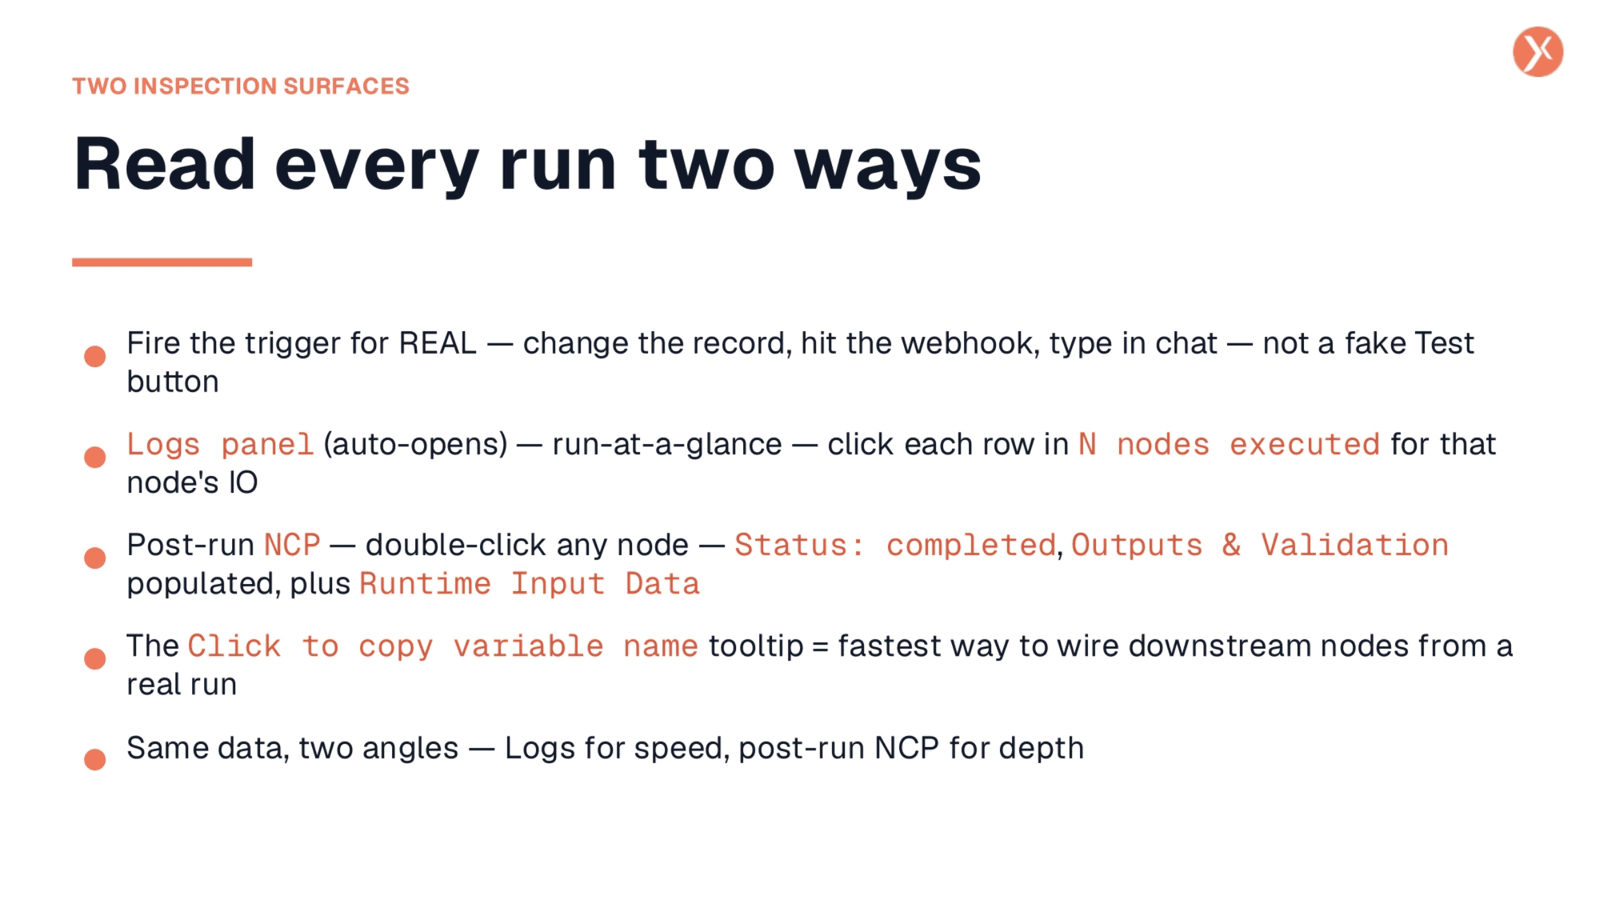
To effectively test, always fire the trigger for real, whether it's changing a record or hitting a webhook. The Logs panel automatically opens, providing an at-a-glance view of executed nodes. For deeper inspection, double-click any node to see its post-run status, outputs, and Runtime Input Data. Use the 'Click to copy variable name' tooltip to quickly wire downstream nodes. These two angles offer both speed and depth in your testing.
Same Data, Two Angles
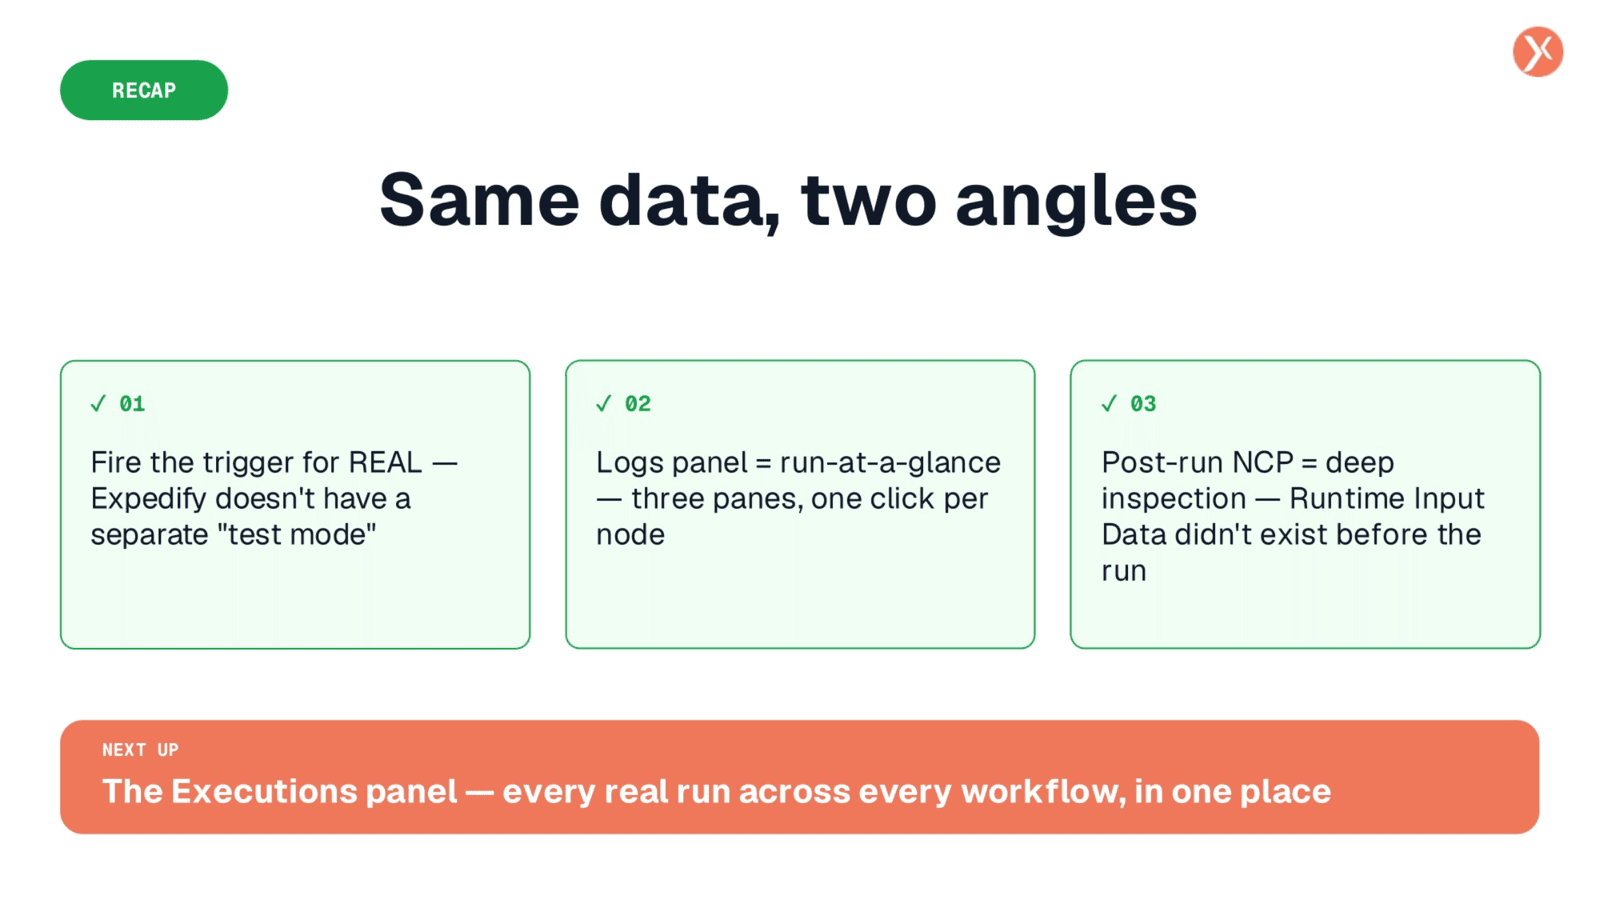
We've covered testing in the Builder, emphasizing the importance of firing triggers for real. The Logs panel offers a quick overview, while the Node Configuration Panel provides deep inspection with Runtime Input Data. Next, we'll explore the Executions panel, which offers a comprehensive view of every real run across all your workflows.