Variables in Action
Today, we're diving into variables in action within Expedify workflows. We'll execute a workflow, then meticulously examine each node to understand its inputs, configuration, and outputs. This process is fundamental to effectively reading and debugging any automation you create.
Inspecting a Node at Runtime
Let's explore inspecting a node at runtime.
Two-node Simple Chat Workflow
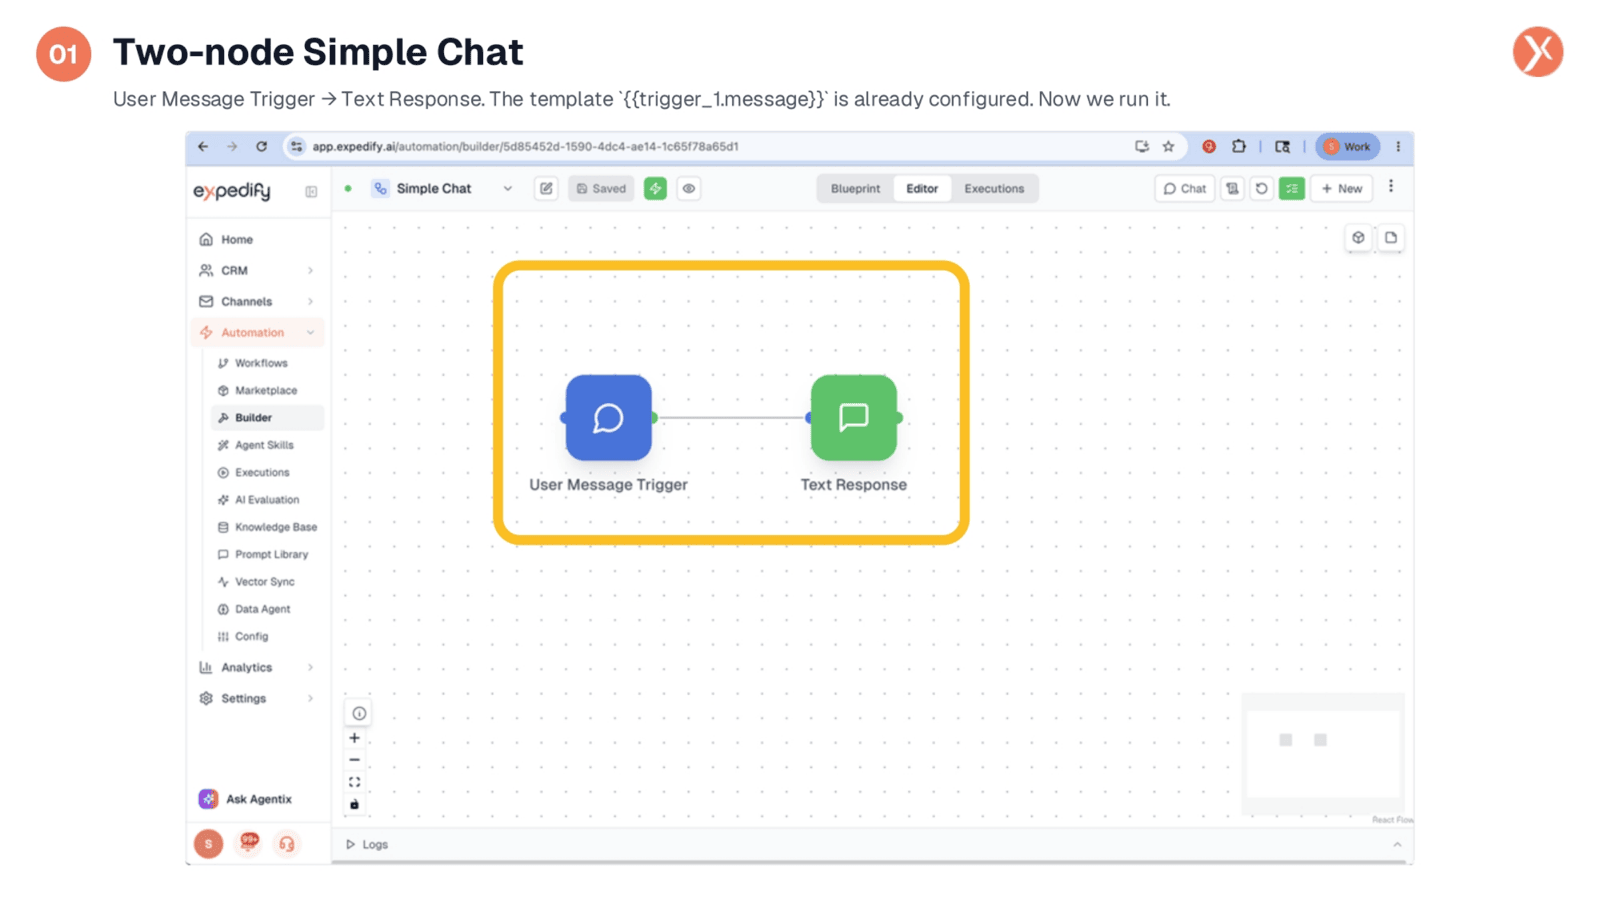
We're using the familiar two-node Simple Chat workflow, featuring a User Message Trigger connected to a Text Response. The Text Response is pre-configured with the template {{trigger_1.message}}, designed to echo the user's input. This setup ensures that whatever the user types into the chat will be returned as the response. The workflow is ready, and we're about to run it to observe how these variables resolve in real-time.
Open Chat to Run the Workflow
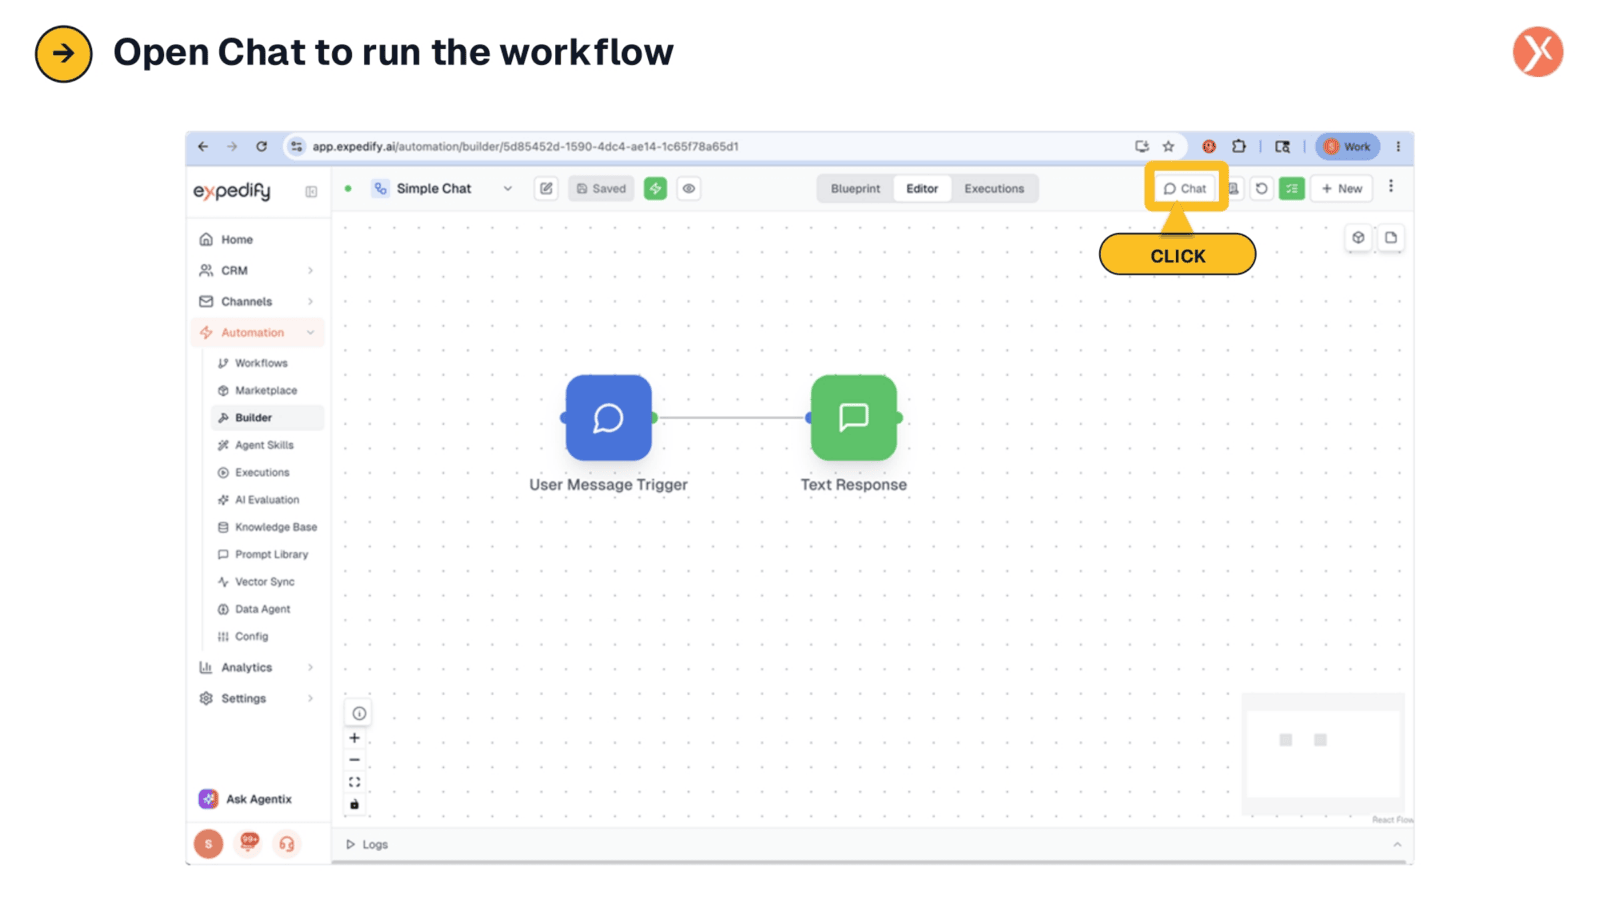
To initiate this workflow and observe its functionality, we'll open the Chat panel. This action allows us to directly interact with the User Message Trigger, providing an input message. Once we send our message, the workflow will execute, demonstrating how the configured template processes and responds to user input in real-time.
Workflow Execution and Green Checks
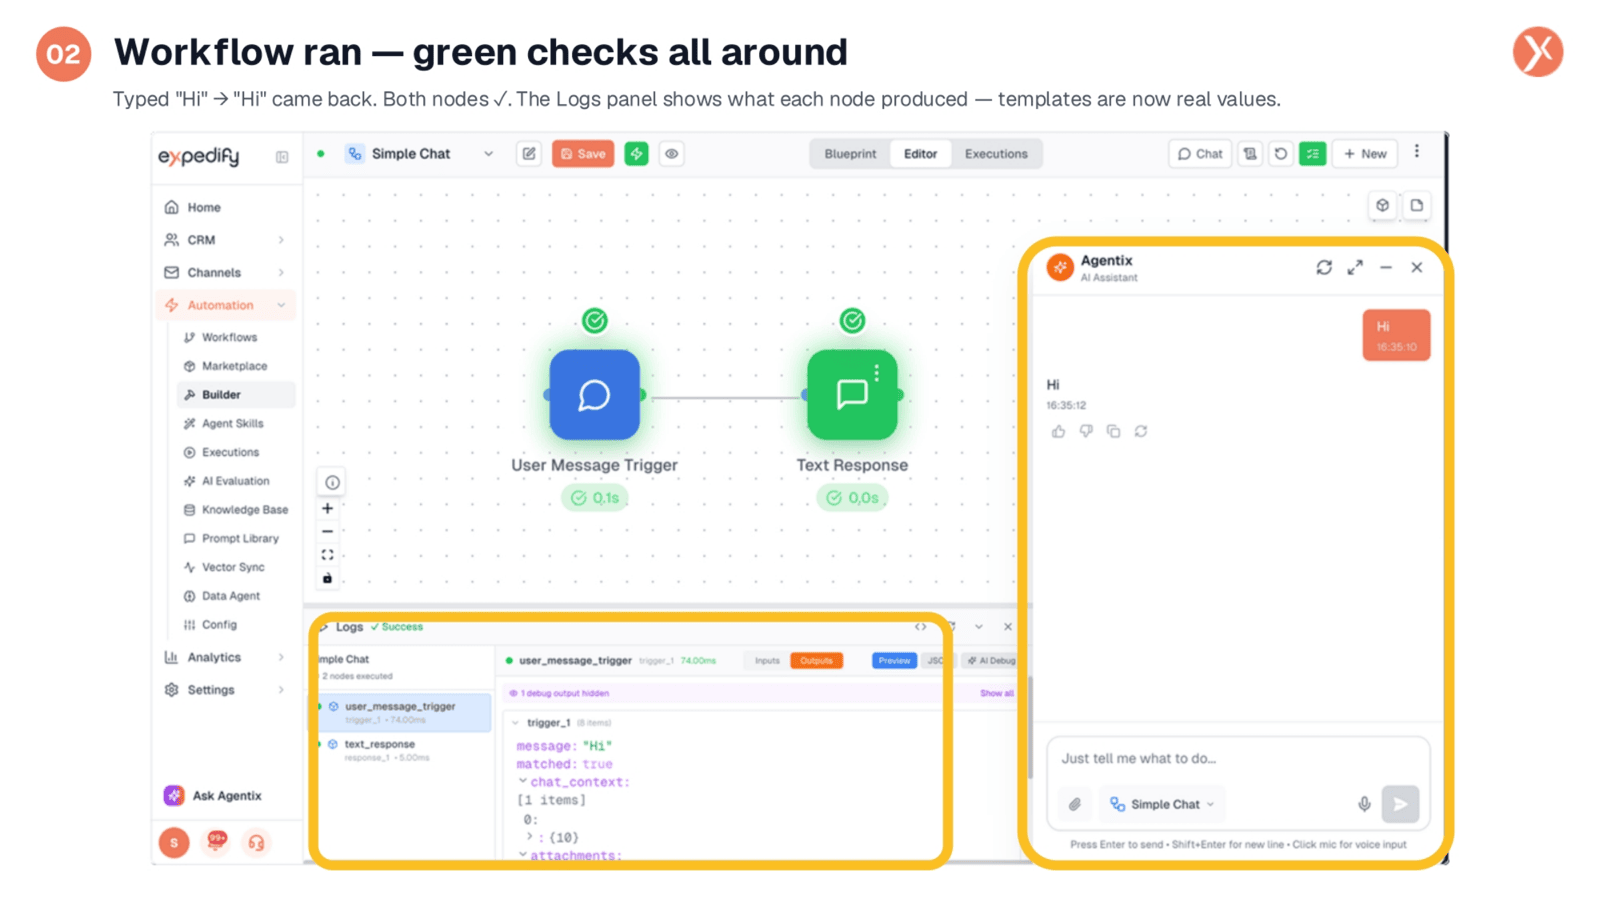
After typing 'Hi' into the chat, we received 'Hi' back, confirming the workflow's successful execution. Notice the green checkmarks on both nodes, indicating completion and displaying their respective execution times. The Logs panel at the bottom provides a concise summary of each node's output. Here, we can clearly see that the trigger_1.message template has resolved from a placeholder into the literal string 'Hi', demonstrating that all templates have successfully processed into real values, ready for inspection.
Double-click Text Response to Inspect
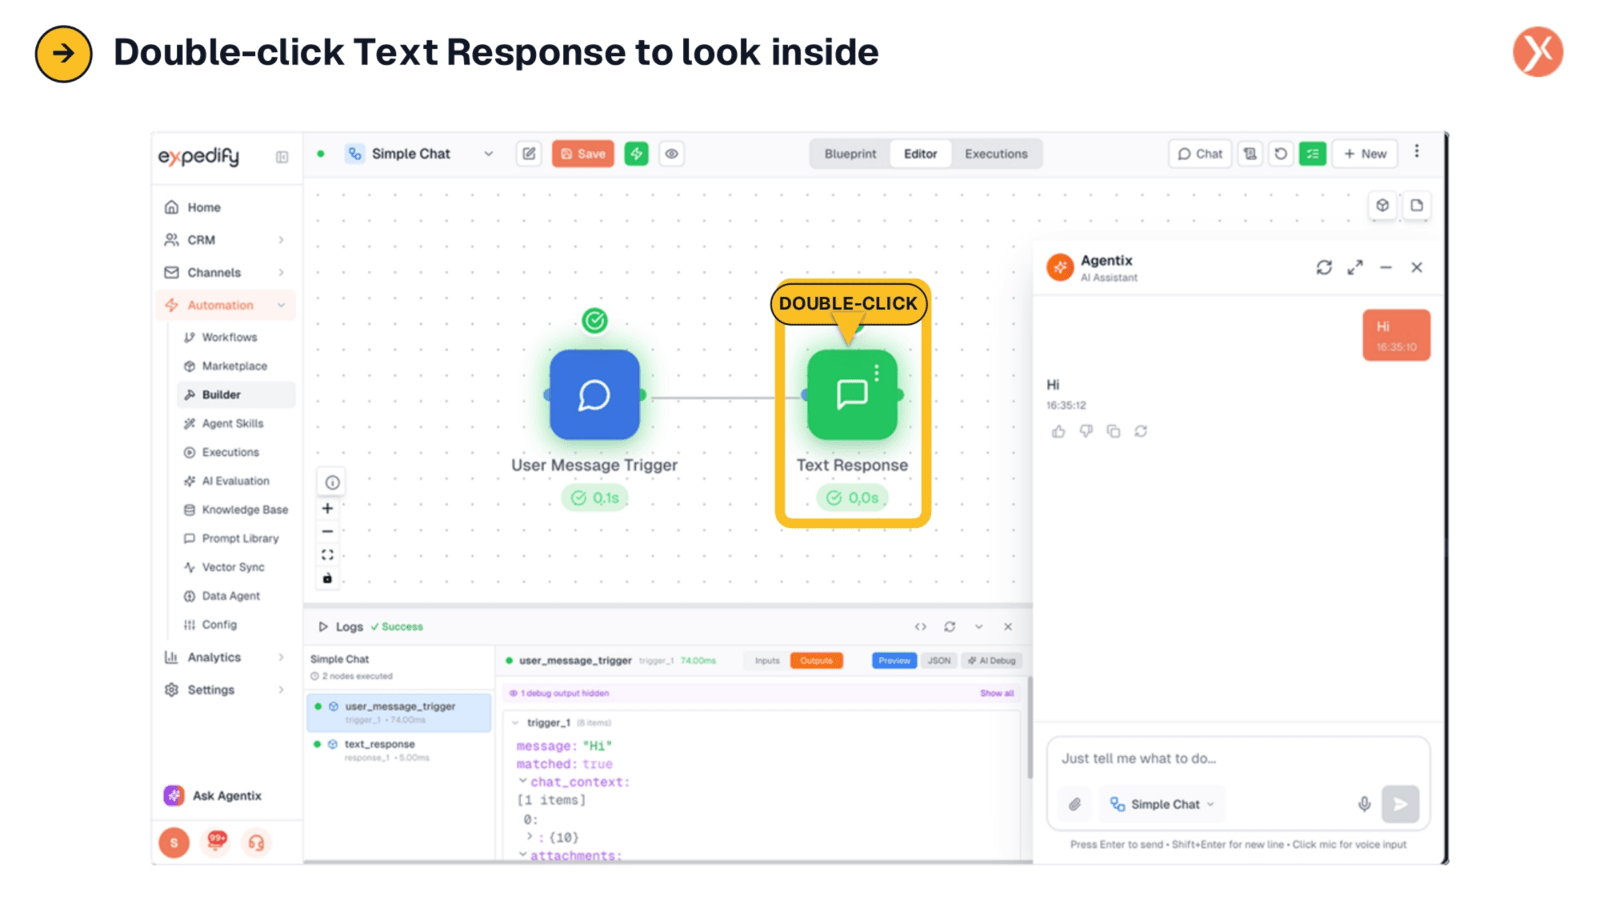
While the Logs panel offers a valuable summary, for a more detailed understanding of a node's operation, we can double-click any node to open its configuration panel, even after the workflow has run. Let's double-click the Text Response node to delve deeper into its internal workings and examine the precise data flow and processing that occurred during execution.
Node Configuration Panel Structure
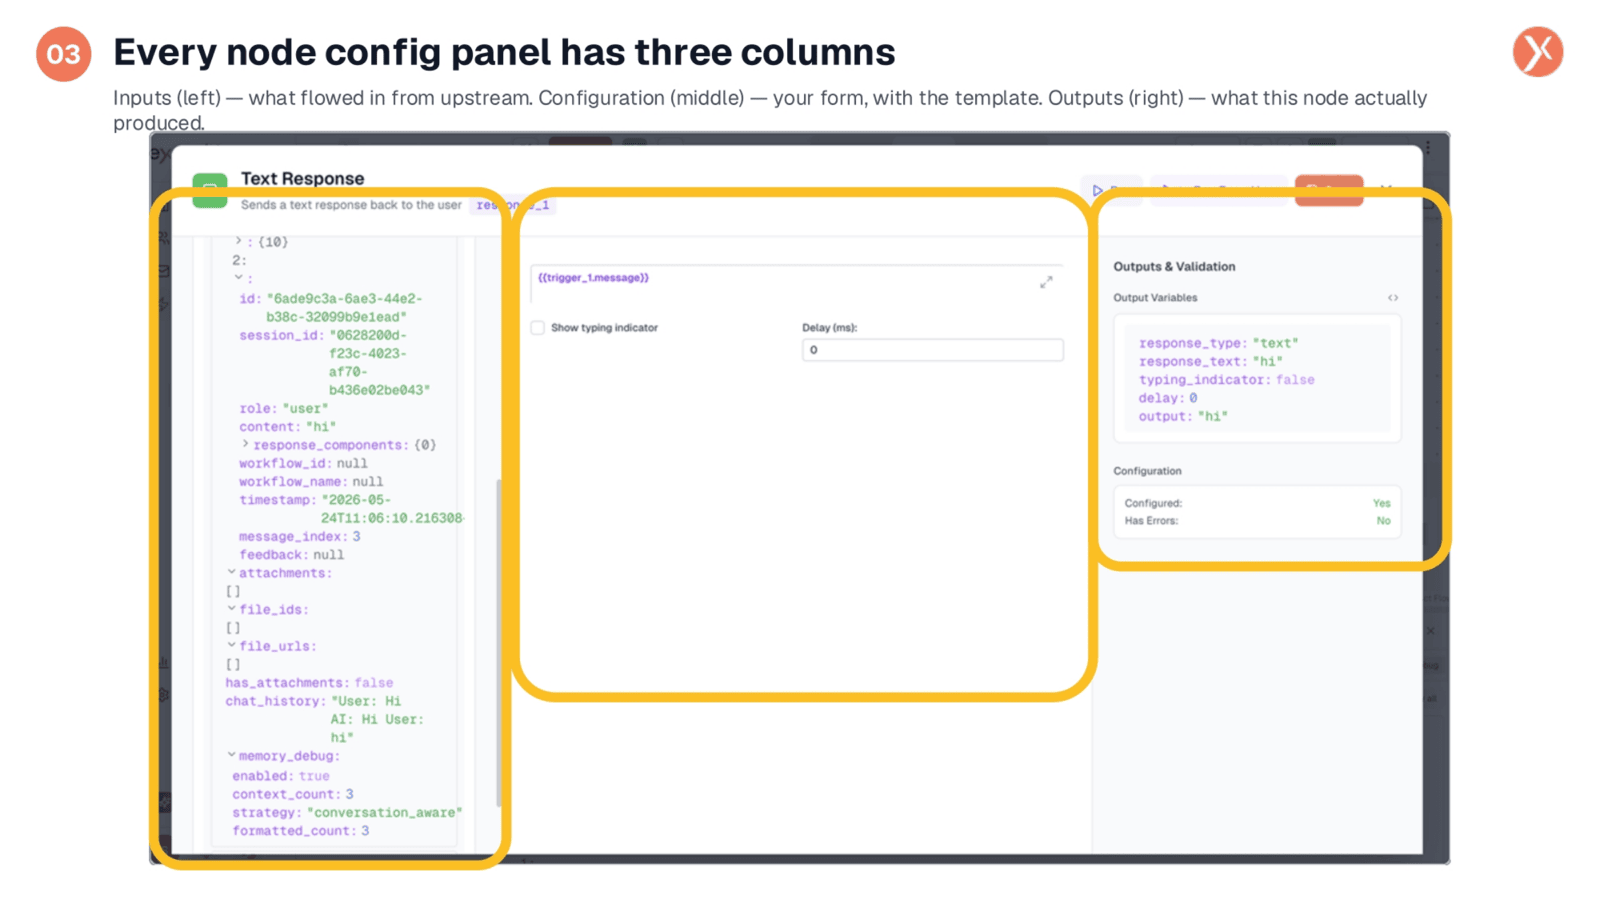
This is the Node Configuration Panel, a crucial interface within the Builder, structured into three distinct columns. On the left, you'll find the Inputs and State, detailing all data that flowed into this node from upstream, such as chat history, attachments, and memory data. The middle column presents the Configuration form, where you define the node's settings and incorporate any templates. Finally, the right column displays the Outputs and Validation, showing the literal values and results produced by this node after its execution.
Variables in the Template Field
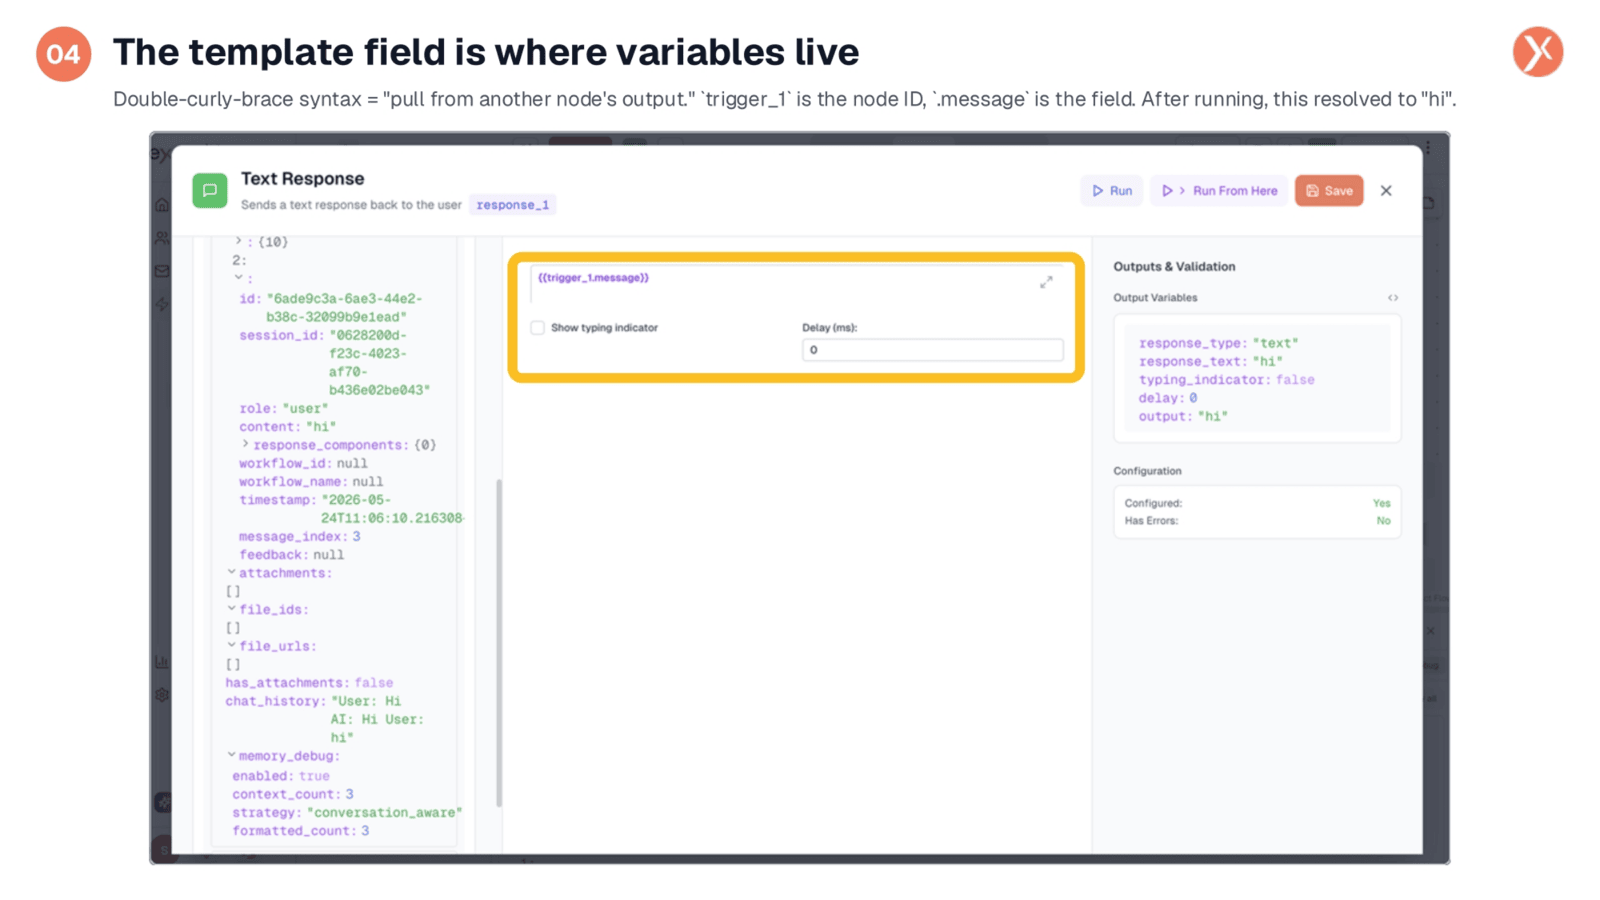
Focusing on the middle column, we see the Response Message field, set to {{trigger_1.message}}. This double-curly-brace syntax signifies a variable, instructing Expedify to resolve it at runtime. trigger_1 refers to the upstream node's ID, and .message specifies the particular field from that node's output. After the workflow executed, this template successfully resolved into the literal string 'hi', which is visible in the Outputs column on the right. This clear progression from a template in the configuration to a real value in the output illustrates the fundamental mechanism of variables within Expedify workflows.
Recap: How to Read a Node
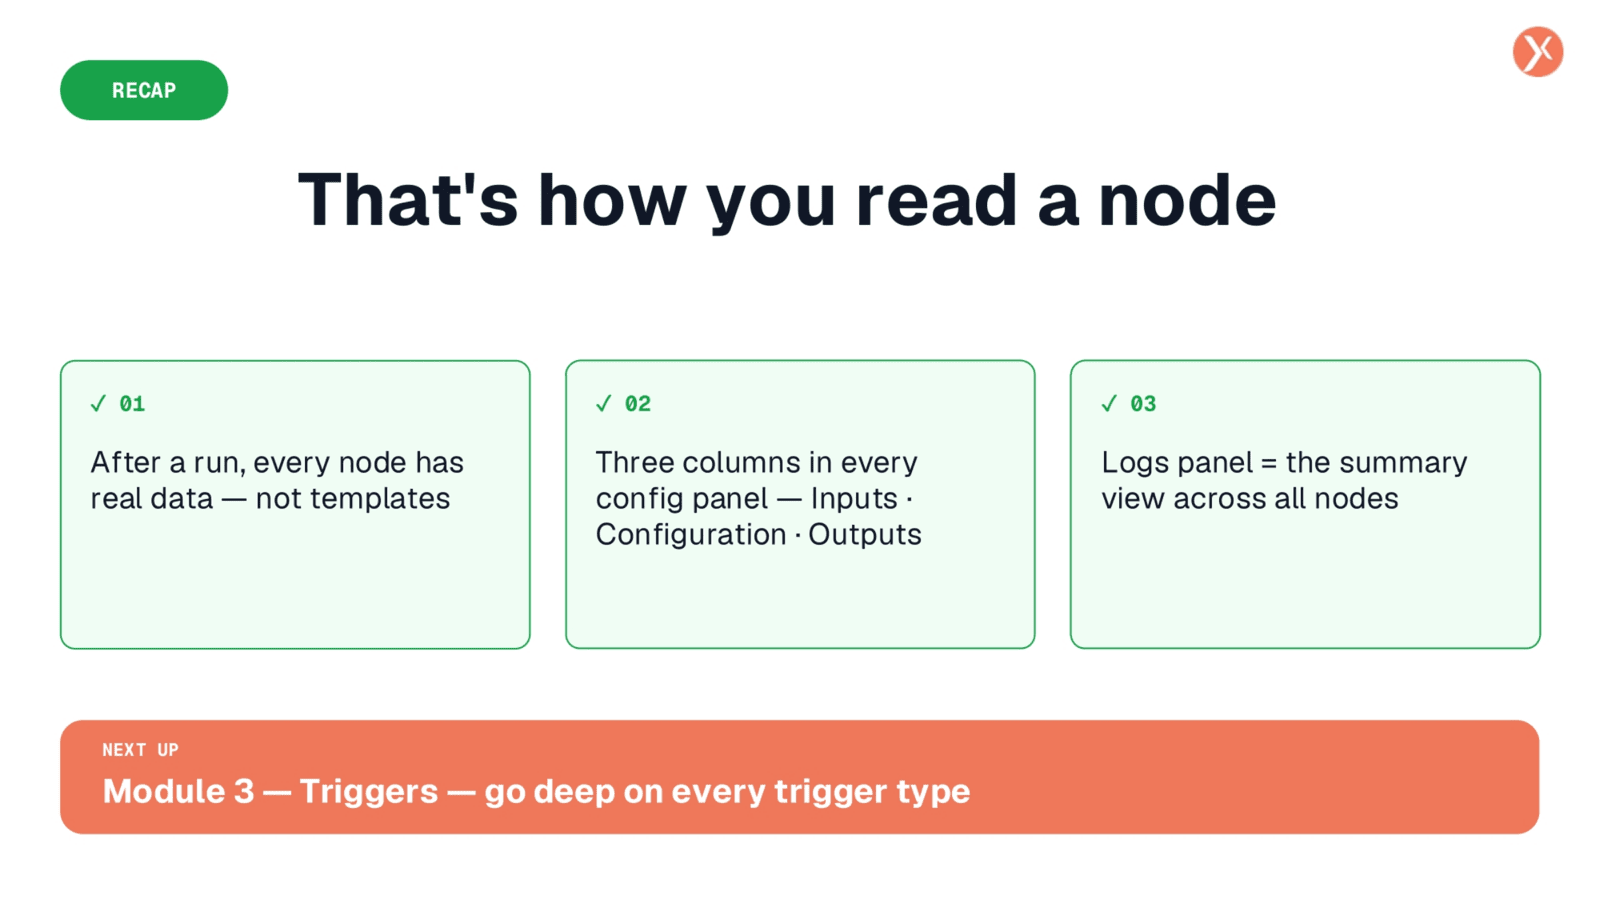
To recap, you can inspect a workflow using the Logs panel for a summary, or by double-clicking a node to examine its Inputs, Configuration, and Outputs. This understanding is key to effective debugging and workflow analysis. Next, we'll explore Expedify's various trigger types.