Smart Charts
Today, we'll explore Smart Charts, a powerful tool for generating visualizations from diverse data sources. We'll cover how to configure the node, adjust its settings, and integrate it with a Response Builder for live chat rendering. This session will guide you through the essential steps to leverage Smart Charts effectively.
Smart Chart Demo Overview
Let's begin our demonstration of Smart Charts. We'll walk through the key components: data input, understanding the various settings, and finally, how to wire it for downstream use. This structured approach will help you grasp the full functionality of the Smart Chart node and its integration capabilities.
Introducing the Smart Chart Node
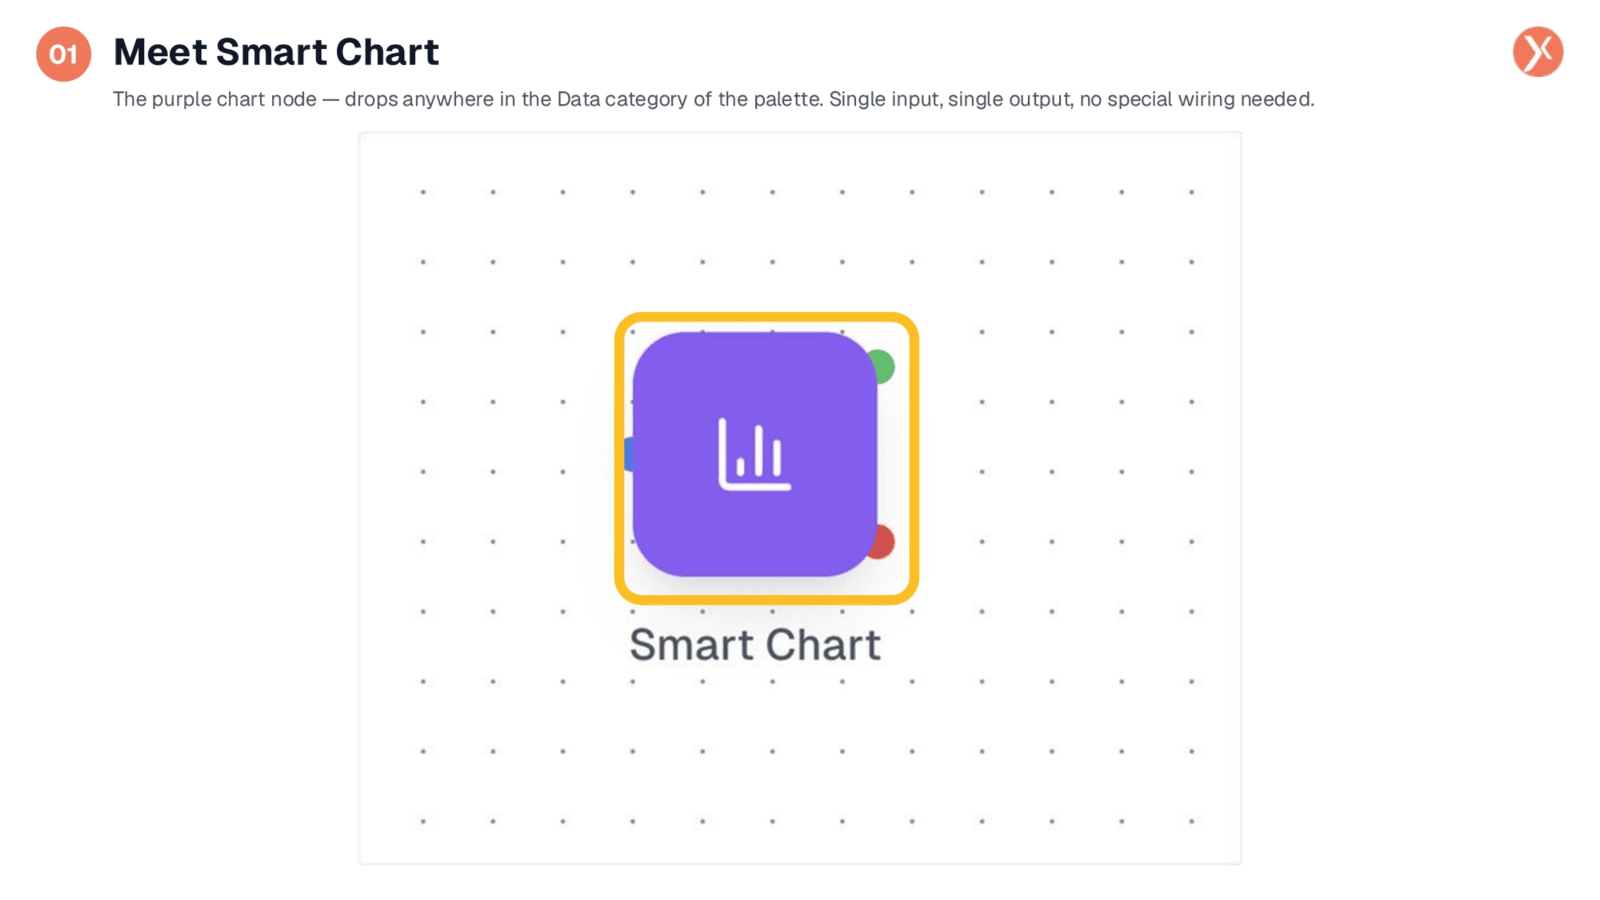
The Smart Chart node, easily identifiable by its purple color and bar-chart icon, is located within the Data category of the Node Palette. It features a single input for data flow and a single output for chart configuration. Simply drop it after any node that provides array data, and it automatically generates a chart without needing LLM credits or manual chart type selection.
Inside Smart Chart: Sparse by Design
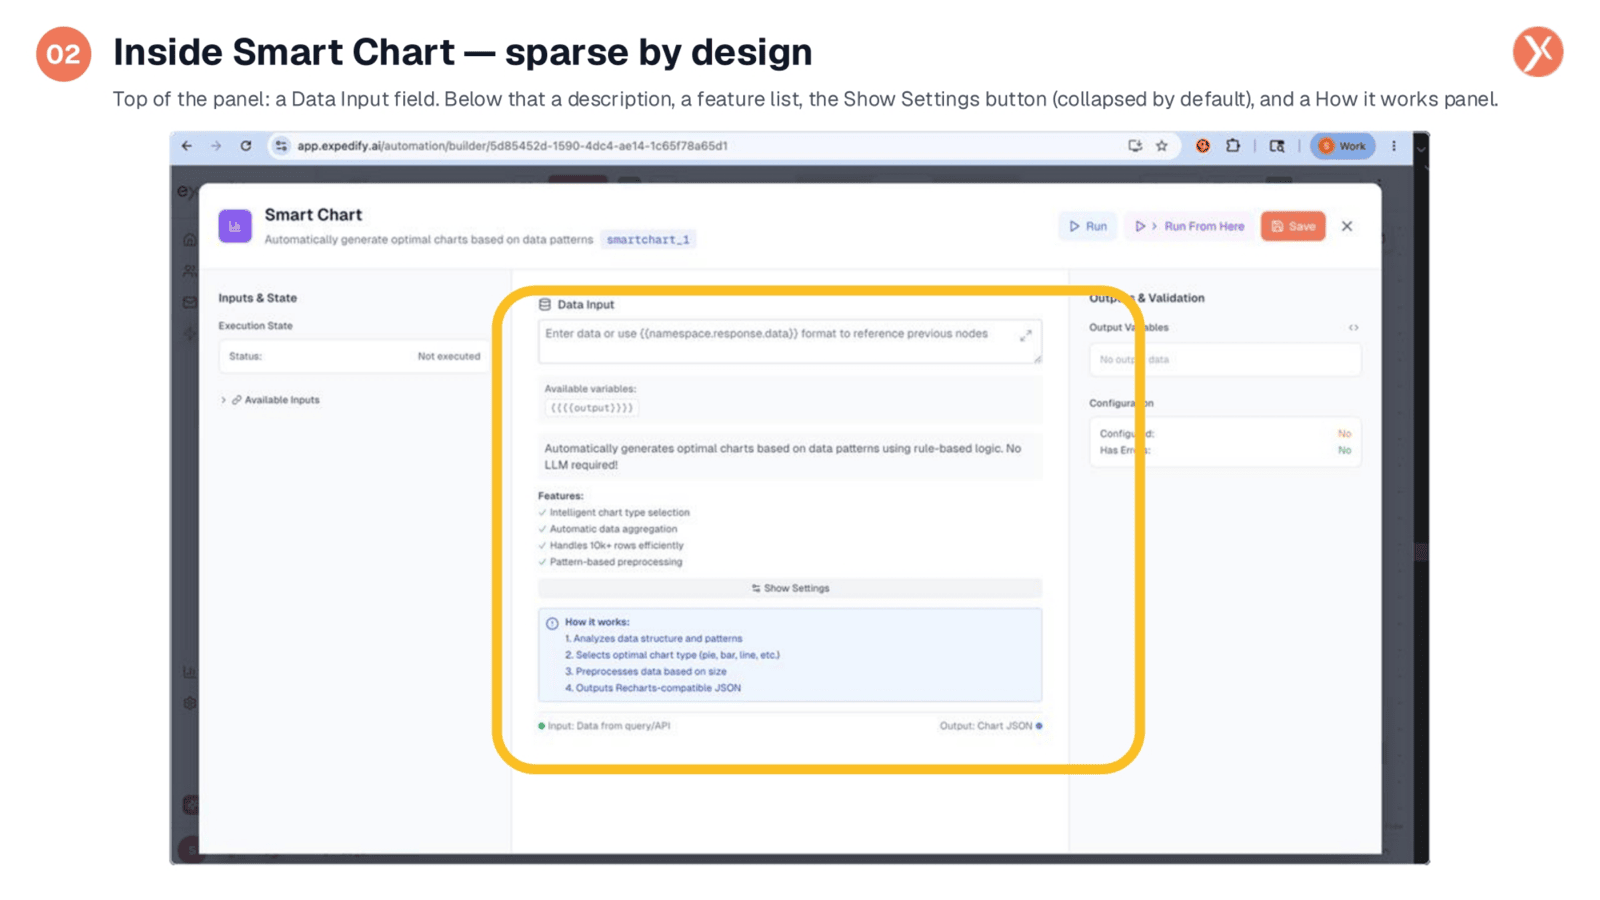
Upon opening the Smart Chart node, you'll notice its minimalist design, with most configurations collapsed by default. The primary Data Input field is prominent. Below it, a features list highlights its capabilities, including intelligent chart type selection, automatic data aggregation, and efficient handling of over ten thousand rows. A 'How it works' panel provides a quick overview of its four-step process, from data analysis to JSON output.
Expanding the Settings
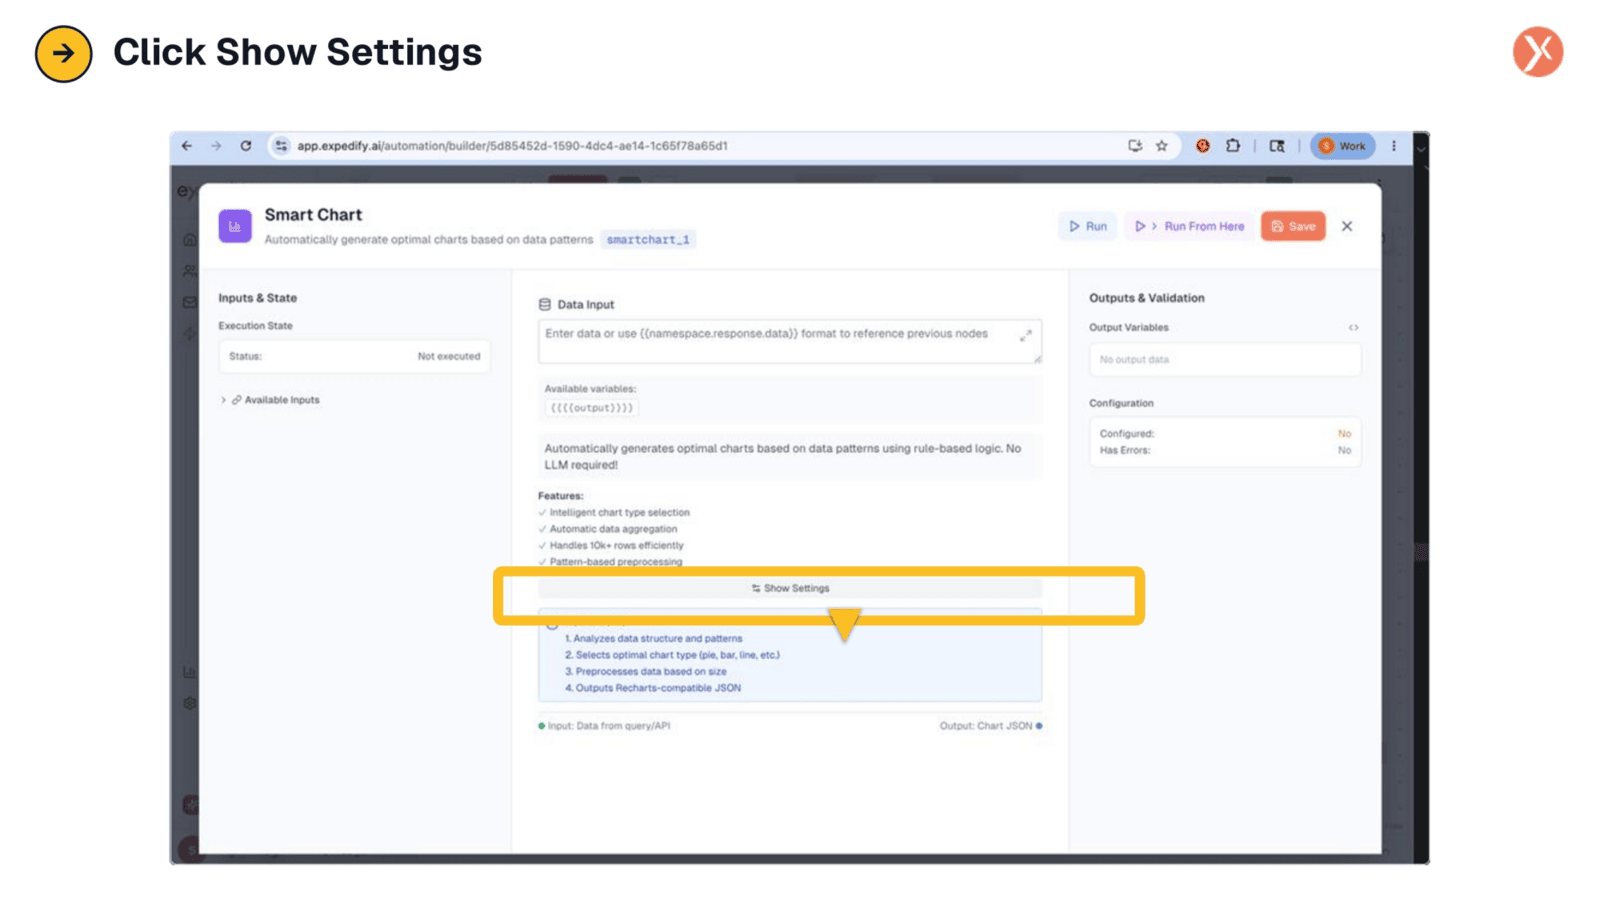
To access the advanced configurations, simply click the 'Show Settings' button. This action expands the panel, revealing additional controls that allow for fine-tuning the chart generation process. While the defaults are often sufficient, understanding these settings provides greater flexibility.
Data Input: Sourcing Your Array Data
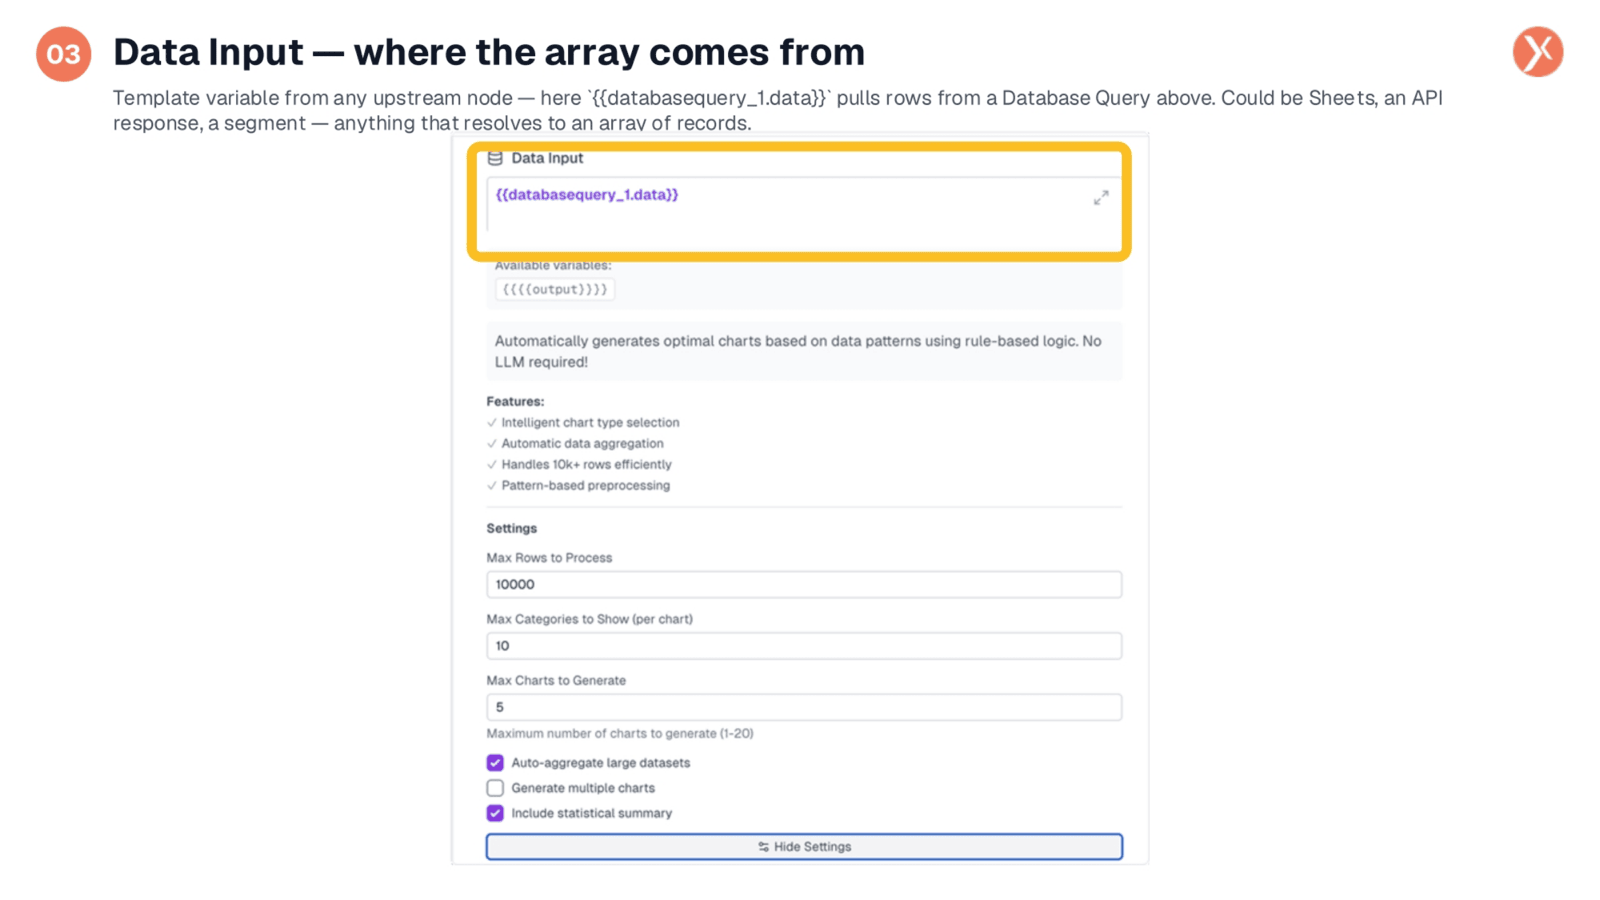
The Data Input field is crucial, expecting a variable reference to array data from a preceding node. For instance, you might use databasequery_1.data from a Database Query. However, it's versatile, accepting inputs from Google Sheets, API responses, CRM segments, or any source that resolves to an array of records. As long as the data is in an array format, Smart Chart can process it effectively.
Settings: Sensible Defaults and Key Controls
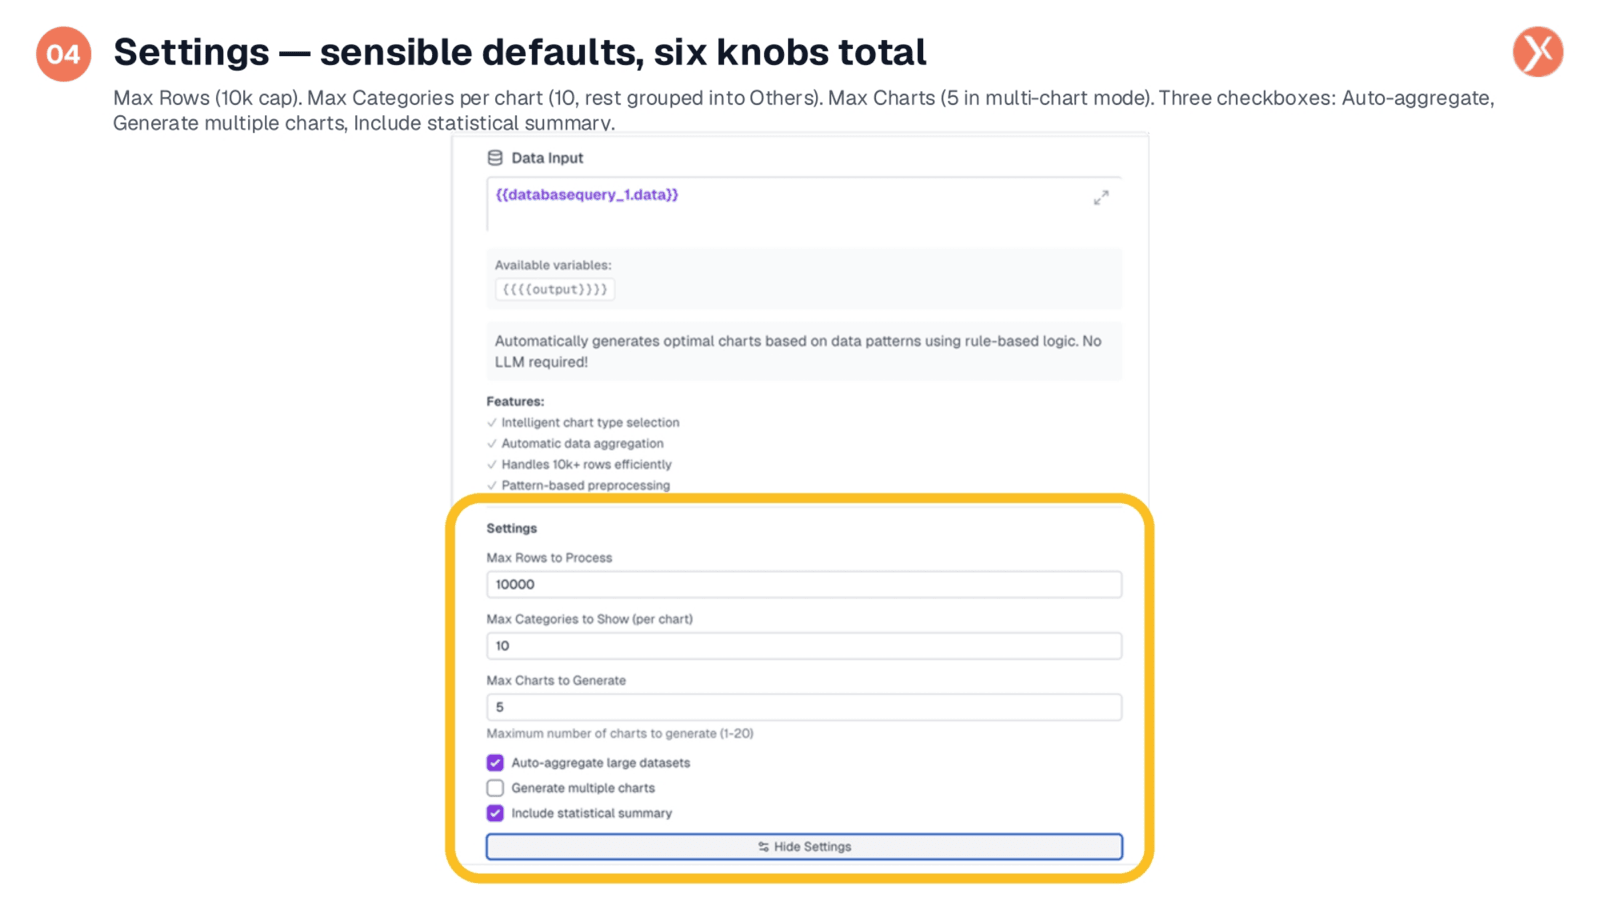
Smart Chart offers six key settings, each with sensible defaults. These include a maximum of ten thousand rows to process, ten categories per chart (with others grouped), and five charts in multi-chart mode. Three checkboxes allow for auto-aggregation of large datasets, generating multiple charts, and including a statistical summary. These defaults are designed to work well for most workflows, minimizing the need for manual adjustments.
Wiring to Chat: Response Builder Integration
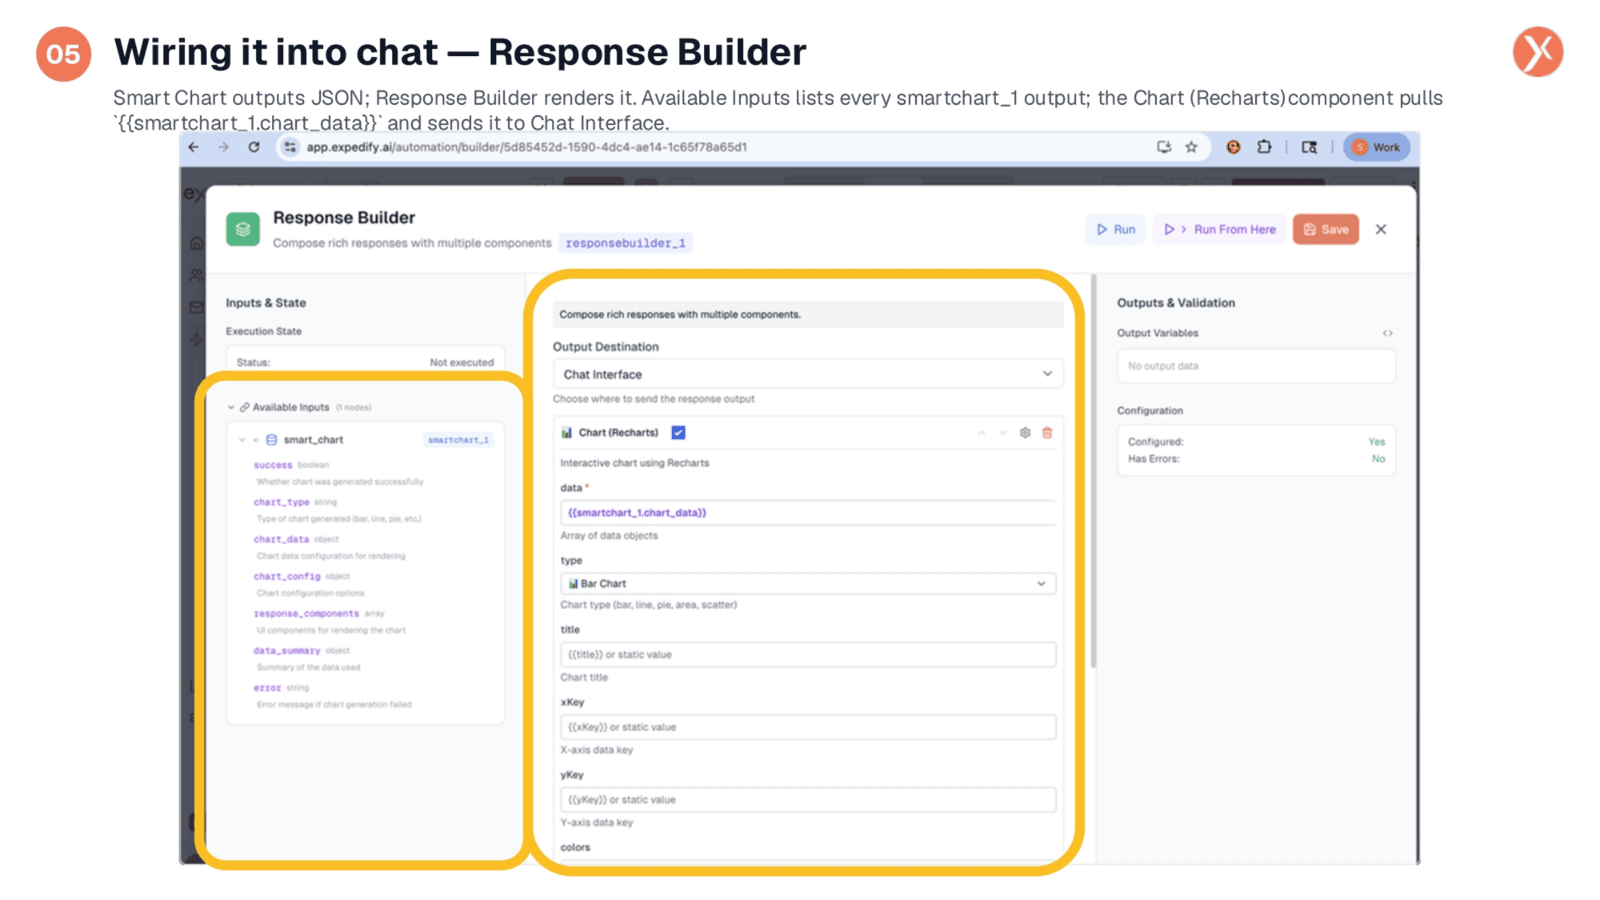
Smart Chart produces JSON output, which the Response Builder then renders. The 'Available Inputs' panel lists all fields exposed by smartchart_1, such as success, chart_type, and chart_data. The Chart (Recharts) component within Response Builder directly pulls smartchart_1.chart_data. By setting the output destination to 'Chat Interface', the chart becomes interactive and live within your chat UI, allowing users to explore data dynamically.
Smart Chart Outputs Explained
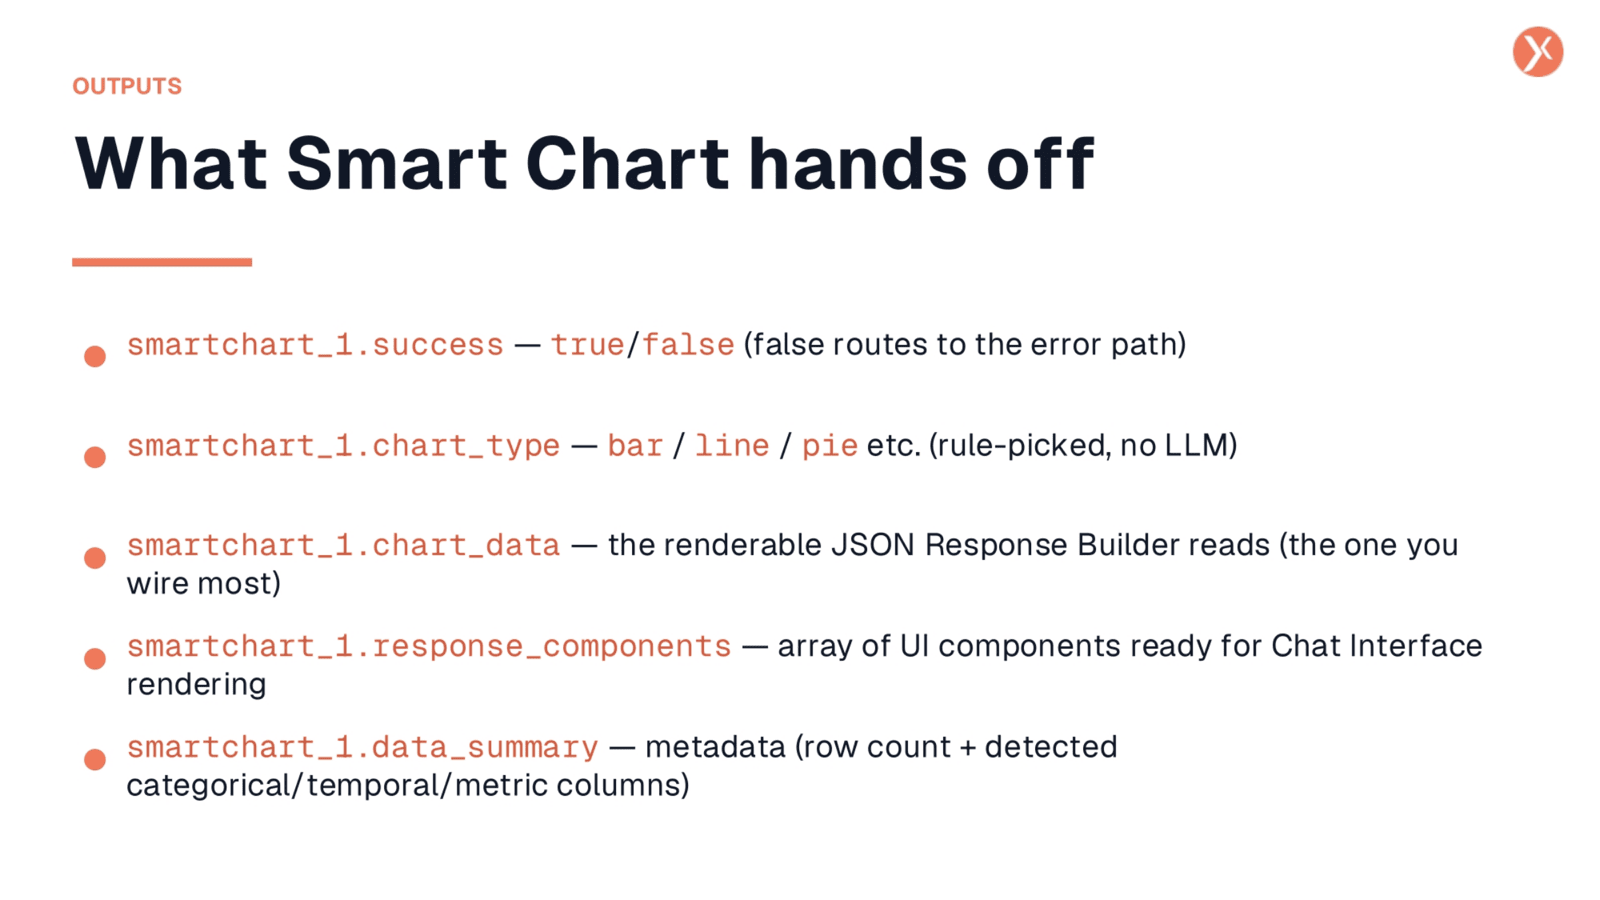
Smart Chart provides five distinct outputs. smartchart_1.success indicates if the chart was generated successfully. smartchart_1.chart_type specifies the rule-picked chart type, such as bar, line, or pie. smartchart_1.chart_data is the renderable JSON, typically wired to Response Builder. smartchart_1.response_components offers prebuilt UI components for chat, and smartchart_1.data_summary provides metadata for debugging or conditional logic.
Smart Chart Recap
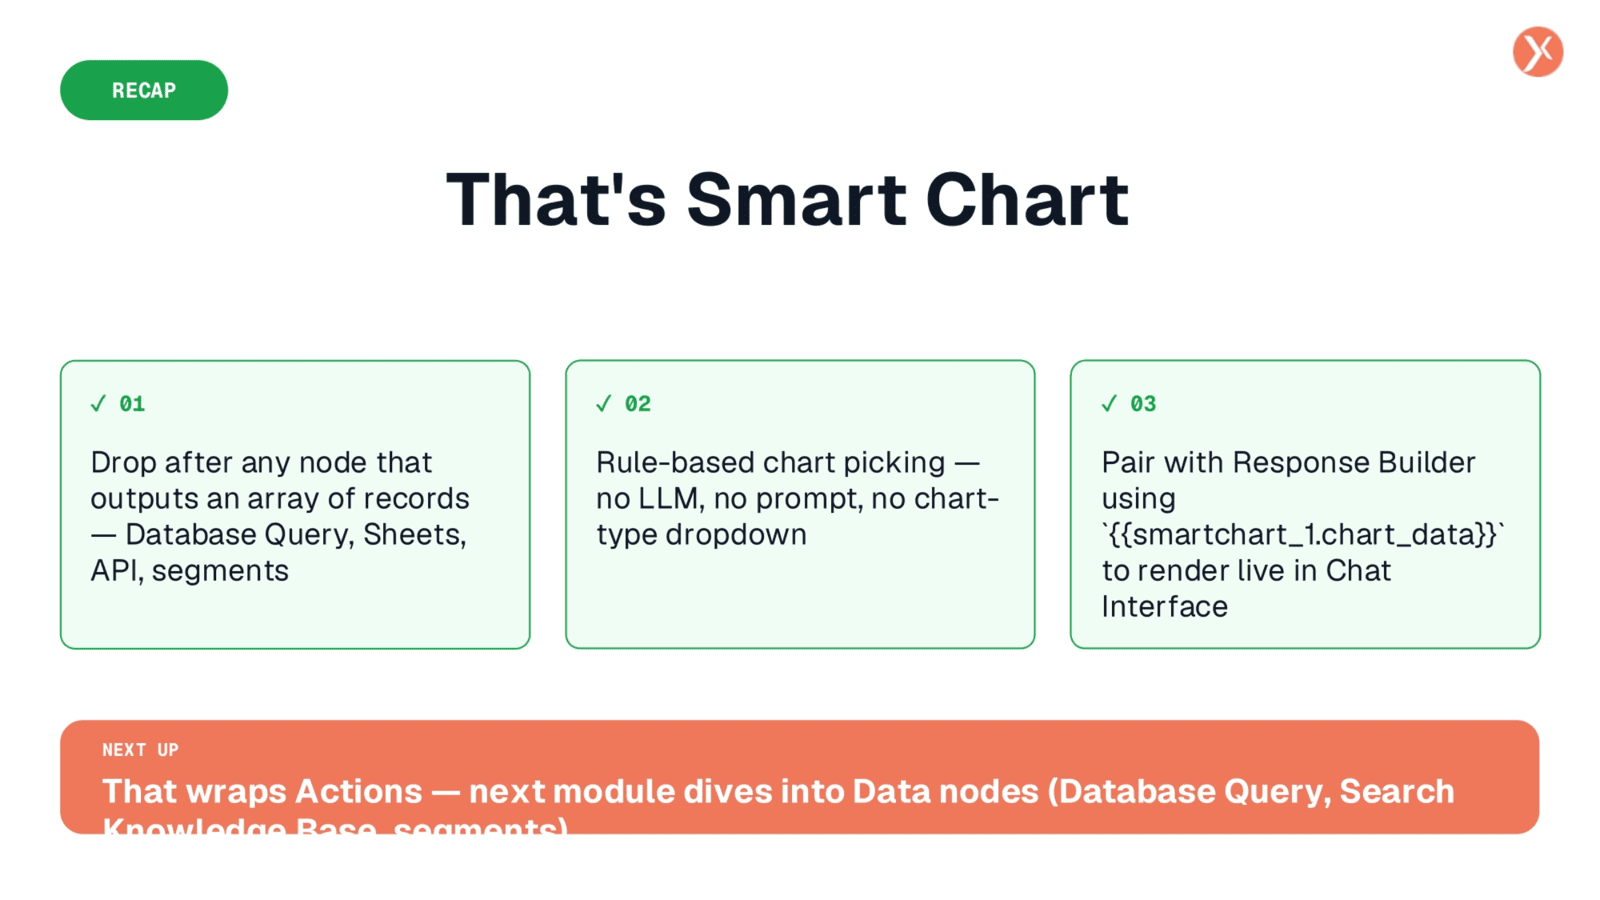
Smart Chart simplifies data visualization, transforming array data into interactive charts. It integrates seamlessly with any node outputting records, uses rule-based logic for chart selection, and pairs with Response Builder for live rendering in your Chat Interface. This concludes our overview of Smart Charts.